| __timestamp | Graco Inc. | United Rentals, Inc. |
|---|---|---|
| Wednesday, January 1, 2014 | 1221130000 | 5685000000 |
| Thursday, January 1, 2015 | 1286485000 | 5817000000 |
| Friday, January 1, 2016 | 1329293000 | 5762000000 |
| Sunday, January 1, 2017 | 1474744000 | 6641000000 |
| Monday, January 1, 2018 | 1653292000 | 8047000000 |
| Tuesday, January 1, 2019 | 1646045000 | 9351000000 |
| Wednesday, January 1, 2020 | 1650115000 | 8530000000 |
| Friday, January 1, 2021 | 1987608000 | 9716000000 |
| Saturday, January 1, 2022 | 2143521000 | 11642000000 |
| Sunday, January 1, 2023 | 2195606000 | 14332000000 |
| Monday, January 1, 2024 | 2113316000 | 15345000000 |
Unleashing insights
In the competitive landscape of industrial equipment, revenue generation is a key indicator of market dominance. Over the past decade, United Rentals, Inc. has consistently outpaced Graco Inc. in revenue, showcasing its robust growth trajectory. From 2014 to 2024, United Rentals' revenue surged by approximately 170%, reaching a peak of $15.3 billion in 2024. In contrast, Graco Inc. experienced a more modest growth of around 73%, with revenues climbing to $2.1 billion in the same period.
United Rentals' strategic expansions and acquisitions have fueled its impressive revenue growth, particularly evident in the 2023-2024 period, where it saw a 7% increase. Meanwhile, Graco Inc. has maintained steady growth, with its revenue peaking in 2023. This data highlights the dynamic nature of the industrial sector and the varying strategies companies employ to capture market share.
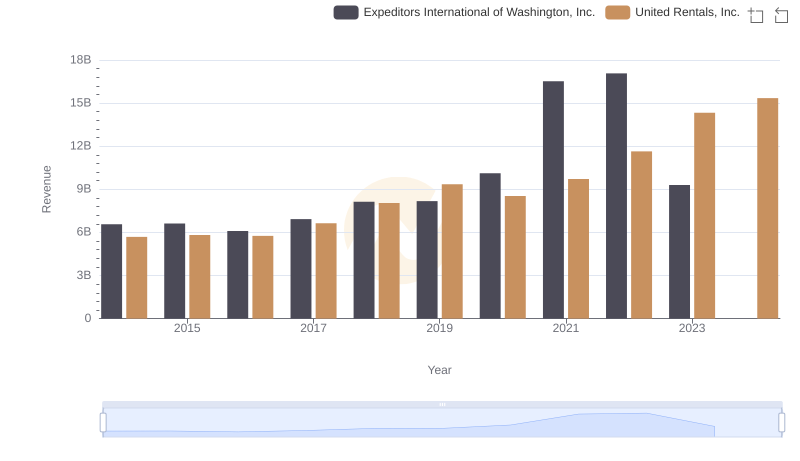
Comparing Revenue Performance: United Rentals, Inc. or Expeditors International of Washington, Inc.?
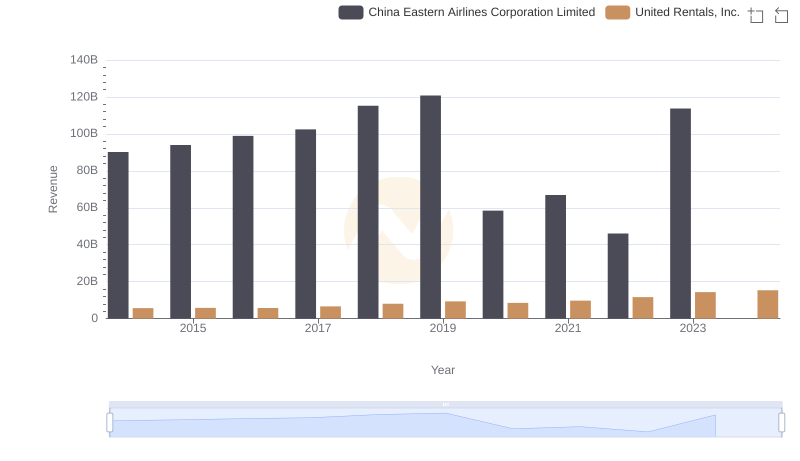
Revenue Insights: United Rentals, Inc. and China Eastern Airlines Corporation Limited Performance Compared
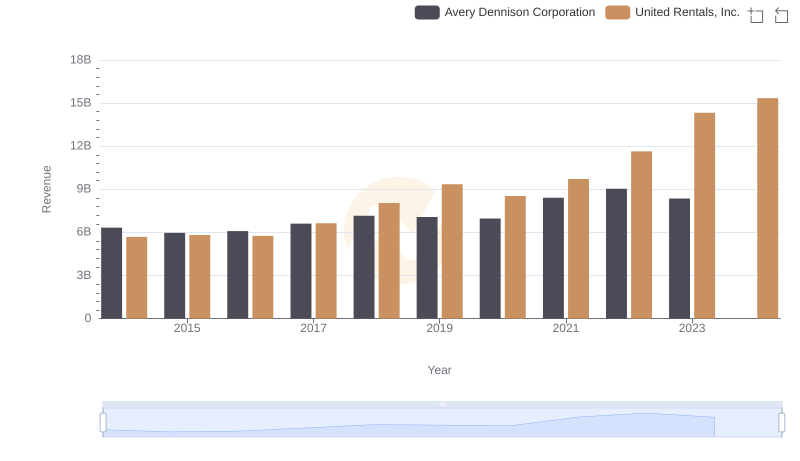
United Rentals, Inc. vs Avery Dennison Corporation: Examining Key Revenue Metrics
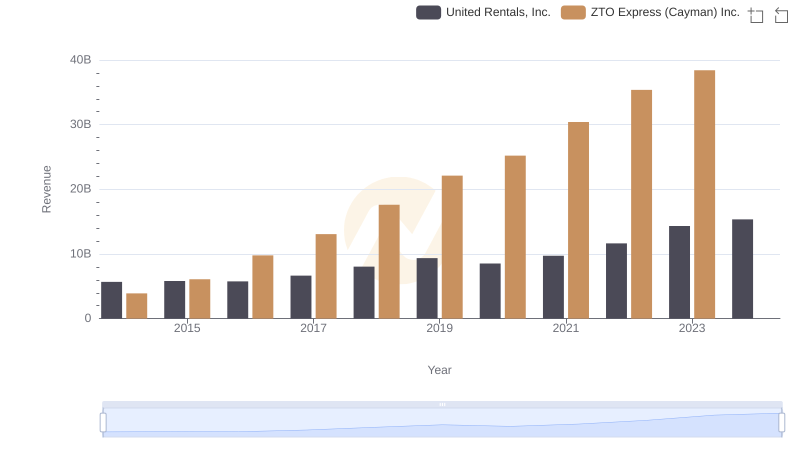
United Rentals, Inc. and ZTO Express (Cayman) Inc.: A Comprehensive Revenue Analysis
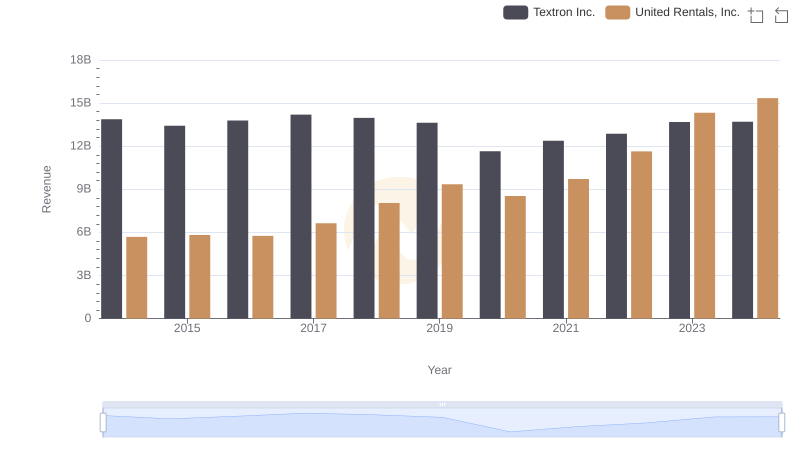
Revenue Insights: United Rentals, Inc. and Textron Inc. Performance Compared
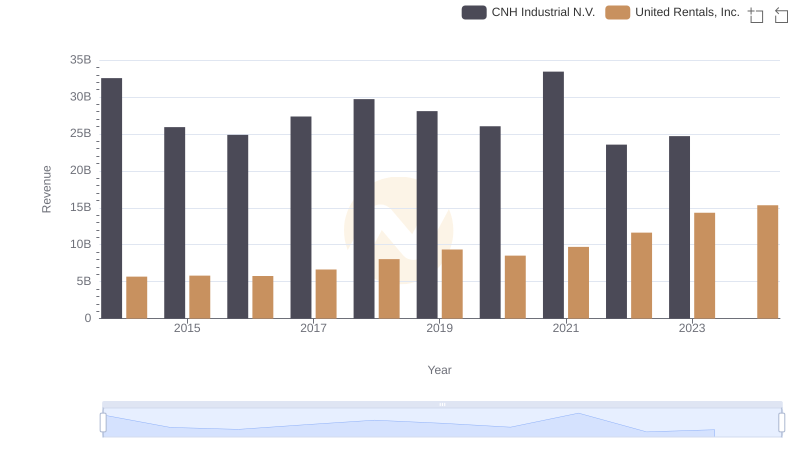
United Rentals, Inc. or CNH Industrial N.V.: Who Leads in Yearly Revenue?
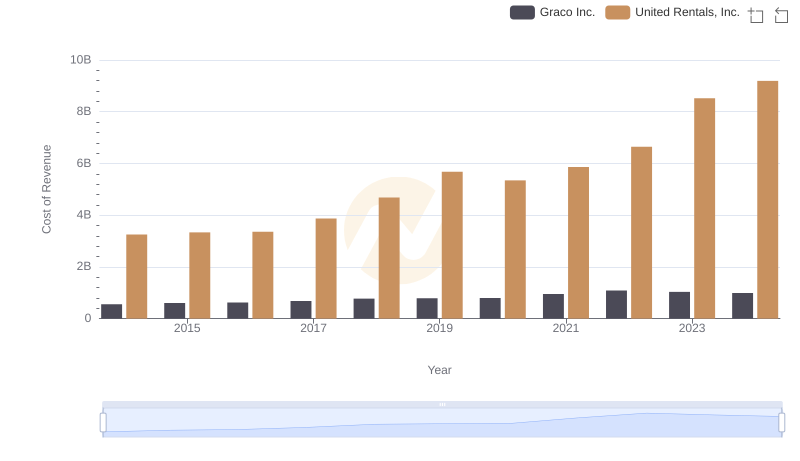
Analyzing Cost of Revenue: United Rentals, Inc. and Graco Inc.
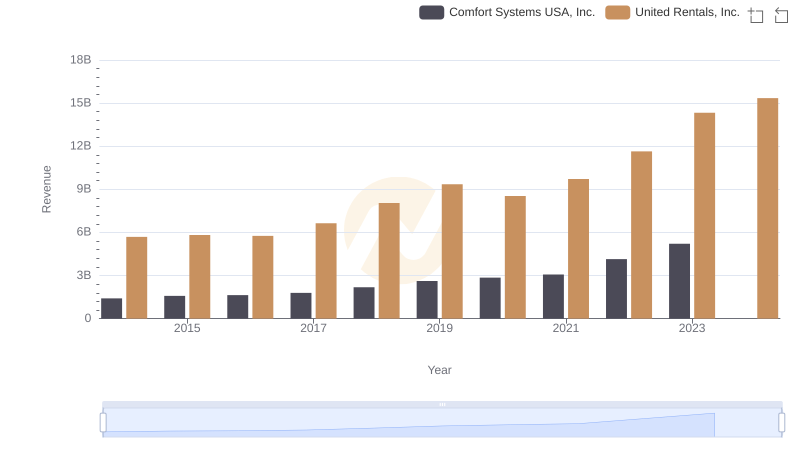
Breaking Down Revenue Trends: United Rentals, Inc. vs Comfort Systems USA, Inc.
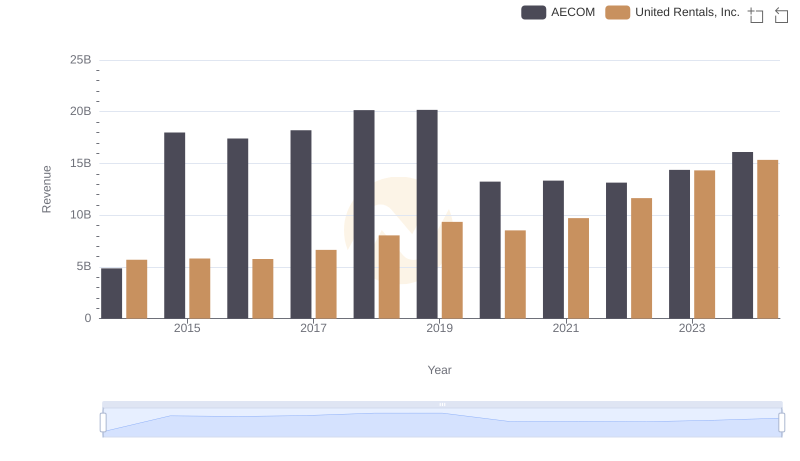
United Rentals, Inc. or AECOM: Who Leads in Yearly Revenue?
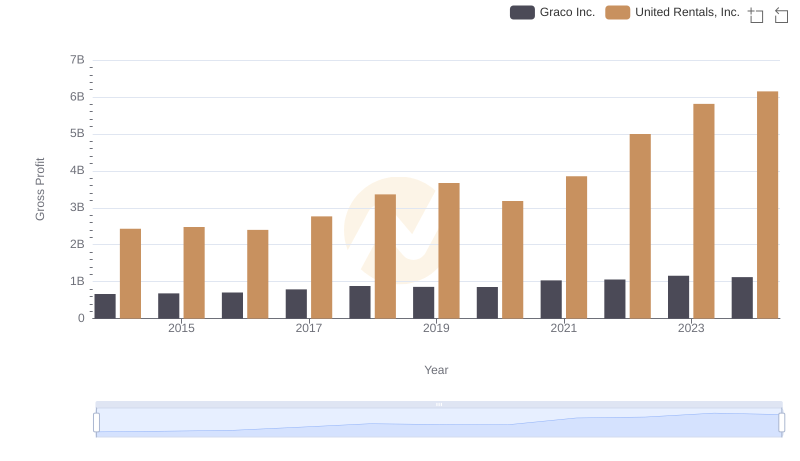
Gross Profit Comparison: United Rentals, Inc. and Graco Inc. Trends
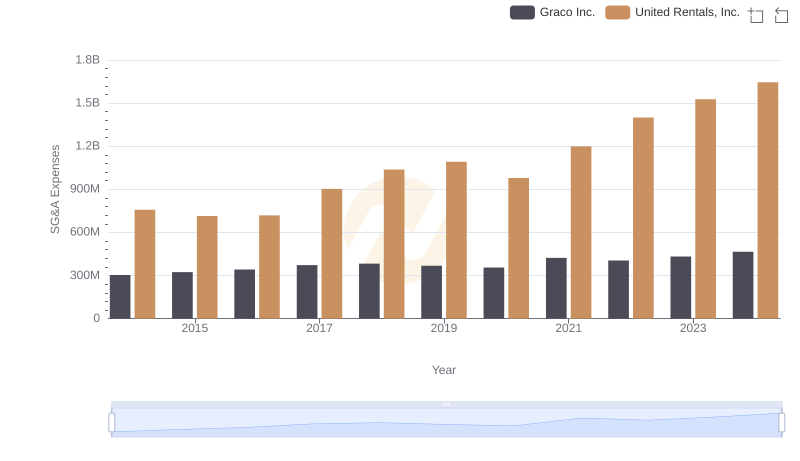
SG&A Efficiency Analysis: Comparing United Rentals, Inc. and Graco Inc.
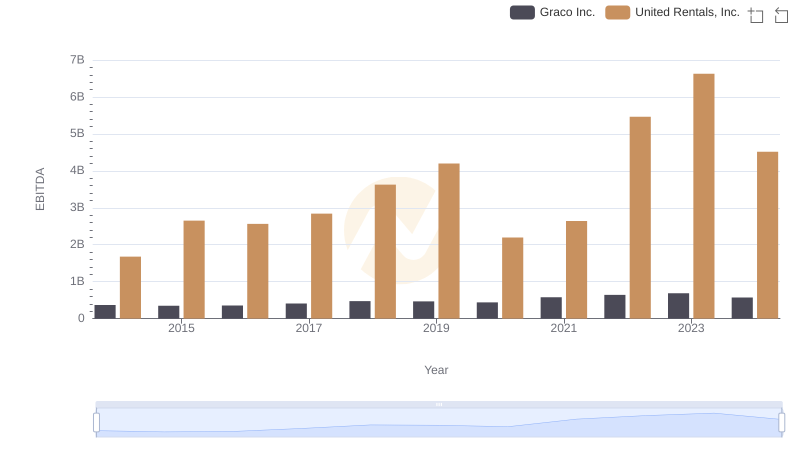
EBITDA Analysis: Evaluating United Rentals, Inc. Against Graco Inc.