| __timestamp | Global Payments Inc. | Jacobs Engineering Group Inc. |
|---|---|---|
| Wednesday, January 1, 2014 | 2773718000 | 12695157000 |
| Thursday, January 1, 2015 | 2898150000 | 12114832000 |
| Friday, January 1, 2016 | 3370976000 | 10964157000 |
| Sunday, January 1, 2017 | 3975163000 | 10022788000 |
| Monday, January 1, 2018 | 3366366000 | 14984646000 |
| Tuesday, January 1, 2019 | 4911892000 | 12737868000 |
| Wednesday, January 1, 2020 | 7423558000 | 13566975000 |
| Friday, January 1, 2021 | 8523762000 | 14092632000 |
| Saturday, January 1, 2022 | 8975515000 | 14922825000 |
| Sunday, January 1, 2023 | 9654419000 | 16352414000 |
| Monday, January 1, 2024 | 10105894000 | 11500941000 |
Unlocking the unknown
In the ever-evolving landscape of global commerce, Global Payments Inc. and Jacobs Engineering Group Inc. stand as titans of industry. Over the past decade, these companies have showcased remarkable revenue trajectories, reflecting their strategic prowess and market adaptability.
From 2014 to 2023, Global Payments Inc. experienced a staggering revenue growth of approximately 248%, surging from $2.8 billion to $9.7 billion. This growth underscores their innovative approach in the financial technology sector. Meanwhile, Jacobs Engineering Group Inc., a leader in engineering solutions, saw a steady increase of around 29% in the same period, reaching $16.4 billion in 2023.
While Global Payments Inc. demonstrated a more volatile yet upward trend, Jacobs Engineering maintained a consistent revenue stream, highlighting their resilience in a competitive market. Notably, data for 2024 is incomplete, leaving room for speculation on future performance.
These insights offer a glimpse into the dynamic world of corporate growth and the strategies that drive success.
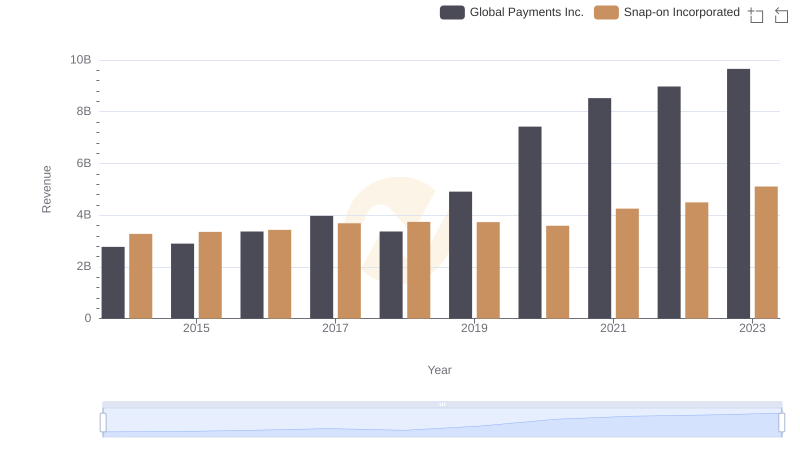
Global Payments Inc. vs Snap-on Incorporated: Examining Key Revenue Metrics
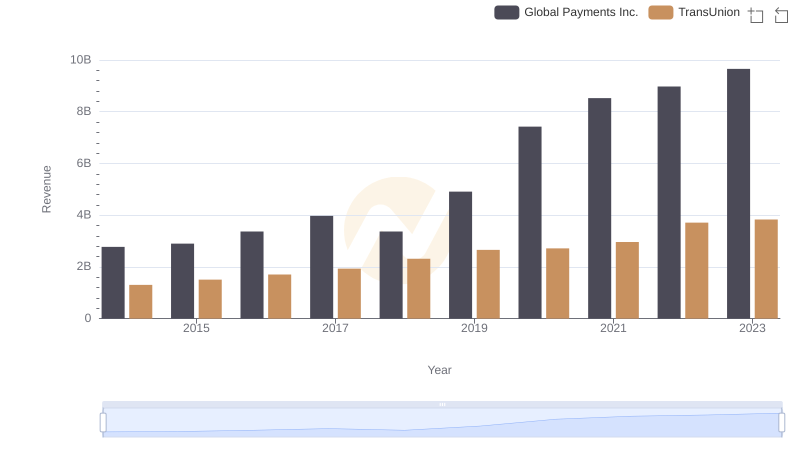
Revenue Insights: Global Payments Inc. and TransUnion Performance Compared
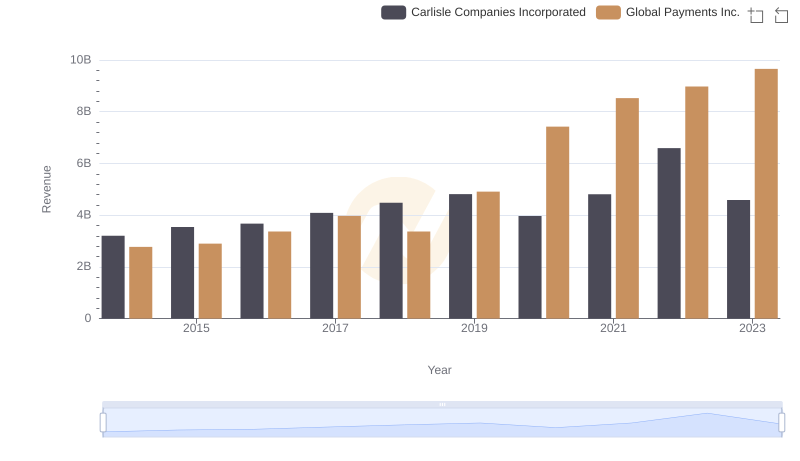
Global Payments Inc. vs Carlisle Companies Incorporated: Examining Key Revenue Metrics
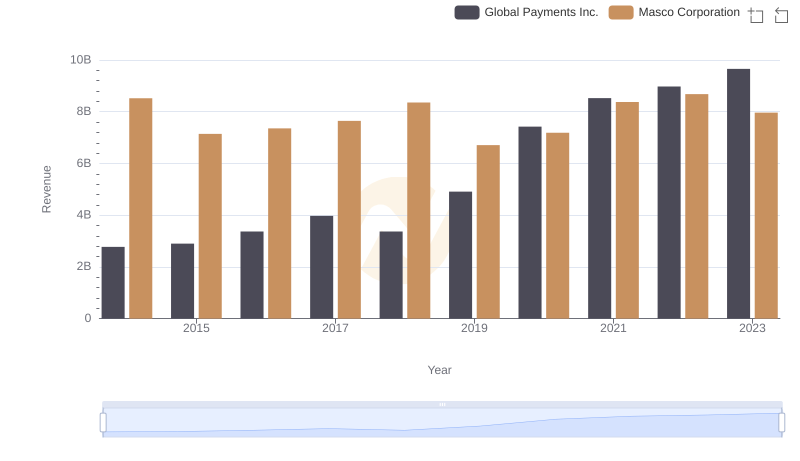
Global Payments Inc. vs Masco Corporation: Examining Key Revenue Metrics
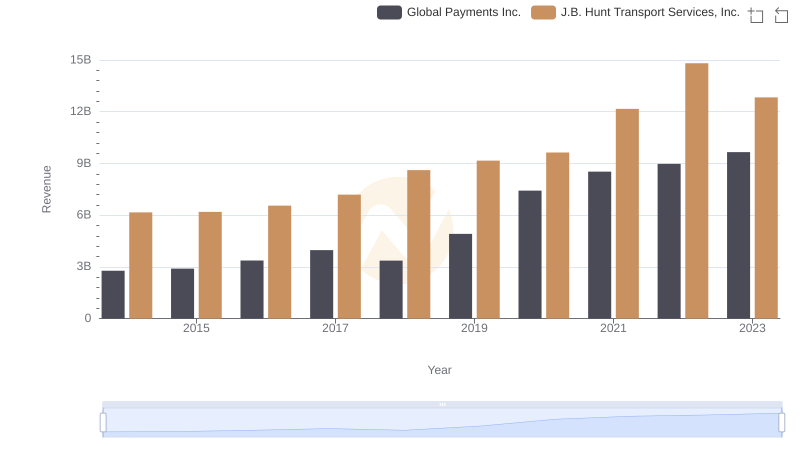
Global Payments Inc. or J.B. Hunt Transport Services, Inc.: Who Leads in Yearly Revenue?
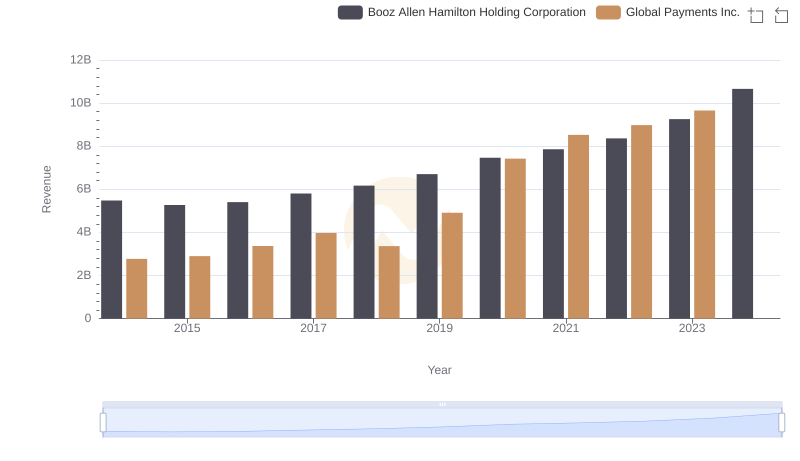
Comparing Revenue Performance: Global Payments Inc. or Booz Allen Hamilton Holding Corporation?
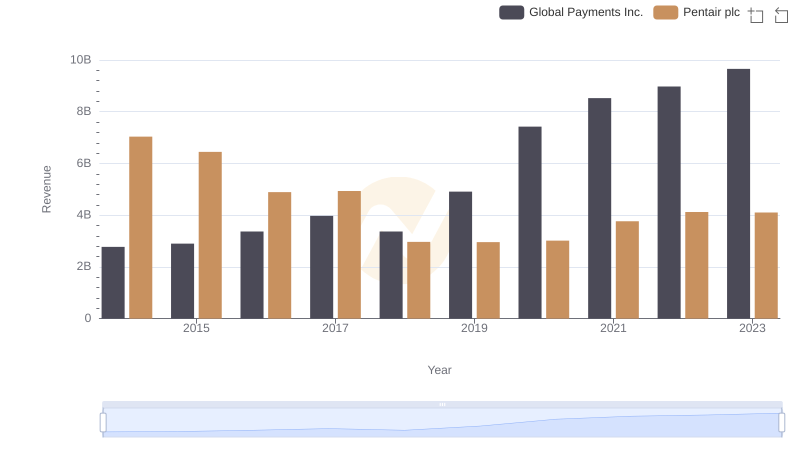
Global Payments Inc. vs Pentair plc: Examining Key Revenue Metrics
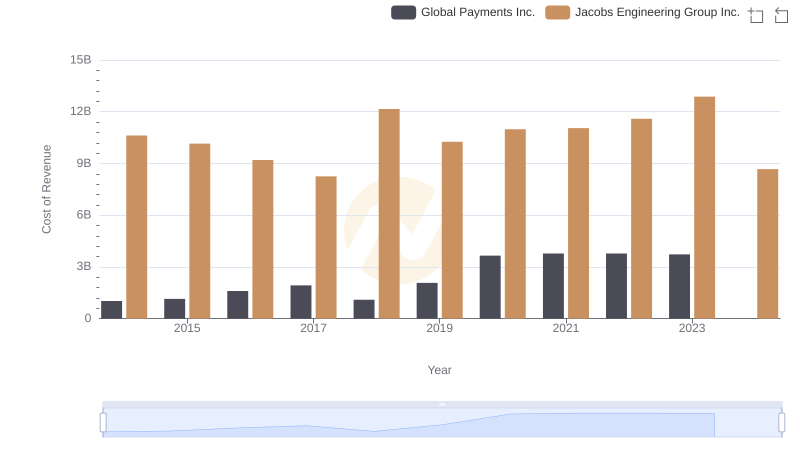
Cost Insights: Breaking Down Global Payments Inc. and Jacobs Engineering Group Inc.'s Expenses
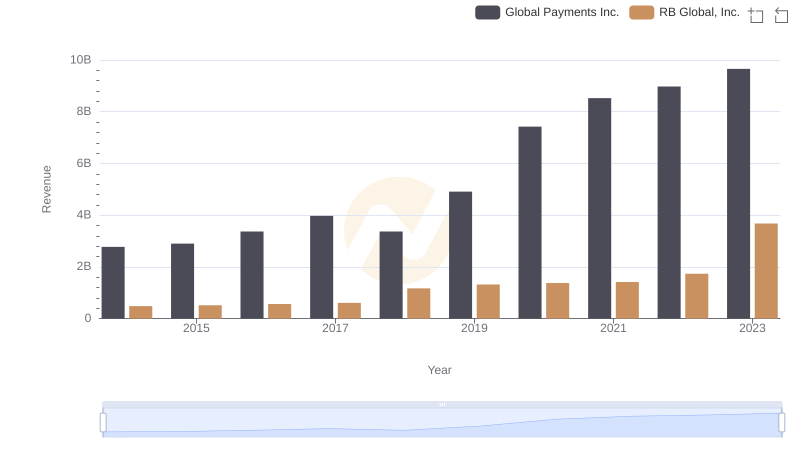
Comparing Revenue Performance: Global Payments Inc. or RB Global, Inc.?
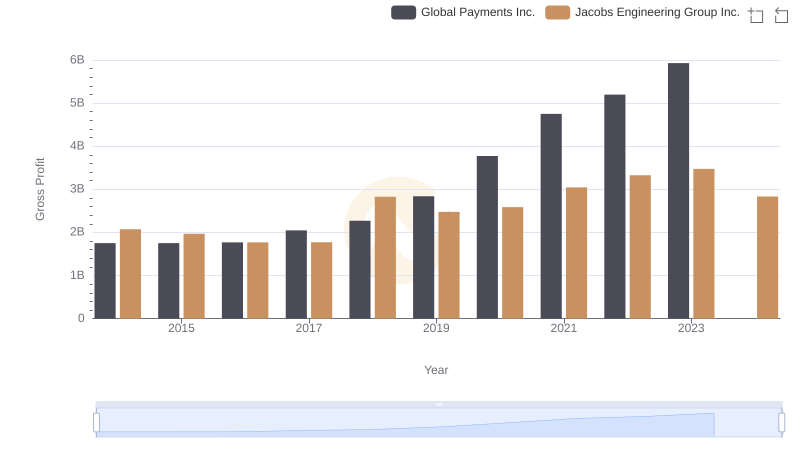
Global Payments Inc. vs Jacobs Engineering Group Inc.: A Gross Profit Performance Breakdown
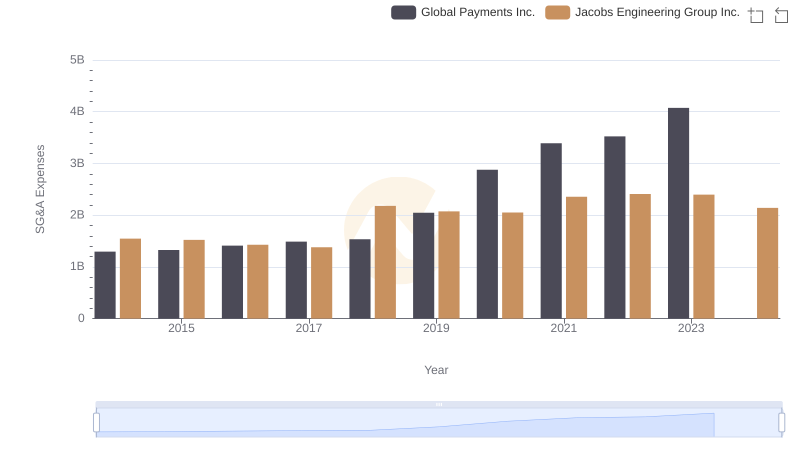
Cost Management Insights: SG&A Expenses for Global Payments Inc. and Jacobs Engineering Group Inc.
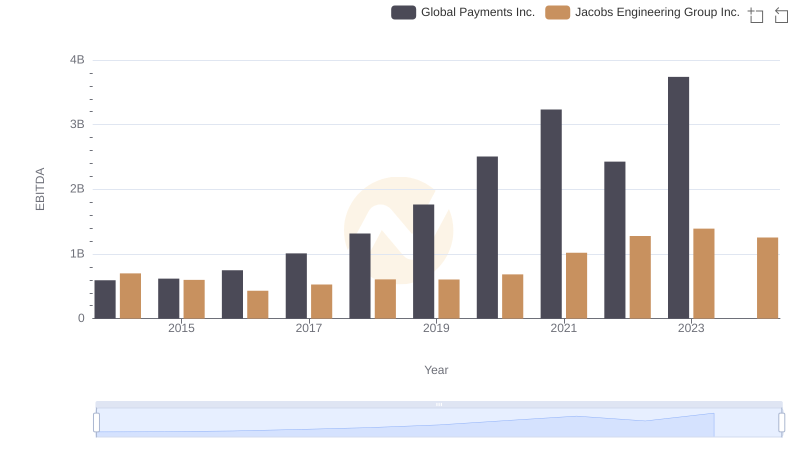
EBITDA Analysis: Evaluating Global Payments Inc. Against Jacobs Engineering Group Inc.