| __timestamp | Carlisle Companies Incorporated | Global Payments Inc. |
|---|---|---|
| Wednesday, January 1, 2014 | 3204000000 | 2773718000 |
| Thursday, January 1, 2015 | 3543200000 | 2898150000 |
| Friday, January 1, 2016 | 3675400000 | 3370976000 |
| Sunday, January 1, 2017 | 4089900000 | 3975163000 |
| Monday, January 1, 2018 | 4479500000 | 3366366000 |
| Tuesday, January 1, 2019 | 4811600000 | 4911892000 |
| Wednesday, January 1, 2020 | 3969900000 | 7423558000 |
| Friday, January 1, 2021 | 4810300000 | 8523762000 |
| Saturday, January 1, 2022 | 6591900000 | 8975515000 |
| Sunday, January 1, 2023 | 4586900000 | 9654419000 |
| Monday, January 1, 2024 | 5003600000 | 10105894000 |
Unleashing insights
In the ever-evolving landscape of global commerce, Global Payments Inc. and Carlisle Companies Incorporated have showcased intriguing revenue trajectories over the past decade. From 2014 to 2023, Global Payments Inc. has seen a remarkable growth, with revenue surging by approximately 248%, peaking in 2023. This growth reflects the company's strategic expansions and adaptability in the digital payment sector. Meanwhile, Carlisle Companies Incorporated, a leader in diversified manufacturing, experienced a more modest revenue increase of around 43% during the same period, with a notable peak in 2022. This divergence highlights the contrasting dynamics of the digital and manufacturing sectors. As we delve into these trends, it becomes evident that while both companies have navigated economic shifts, their paths underscore the unique challenges and opportunities within their respective industries.
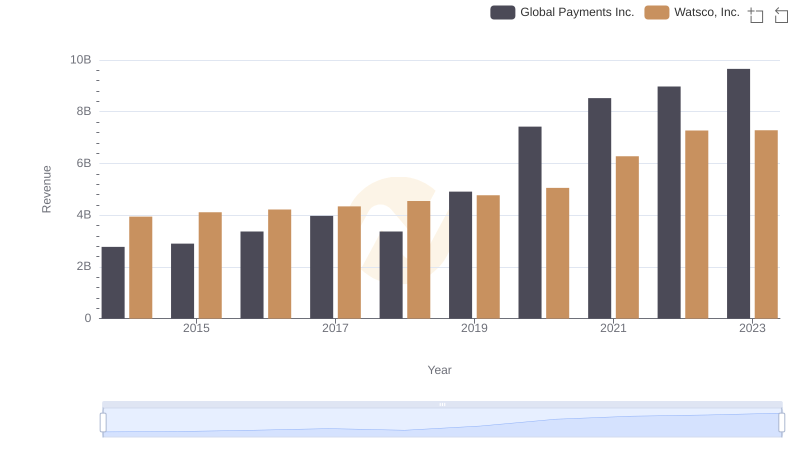
Revenue Showdown: Global Payments Inc. vs Watsco, Inc.
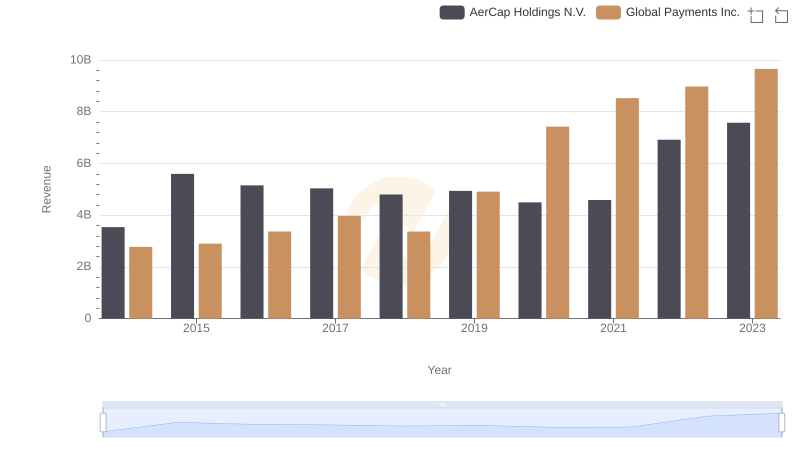
Global Payments Inc. vs AerCap Holdings N.V.: Examining Key Revenue Metrics
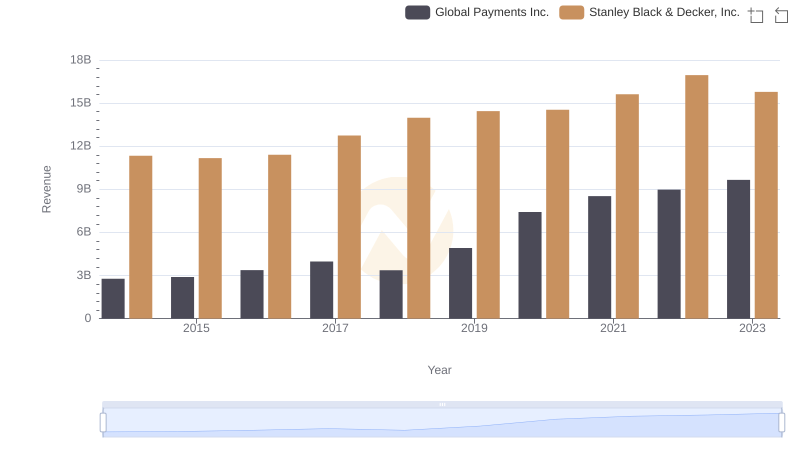
Global Payments Inc. vs Stanley Black & Decker, Inc.: Examining Key Revenue Metrics
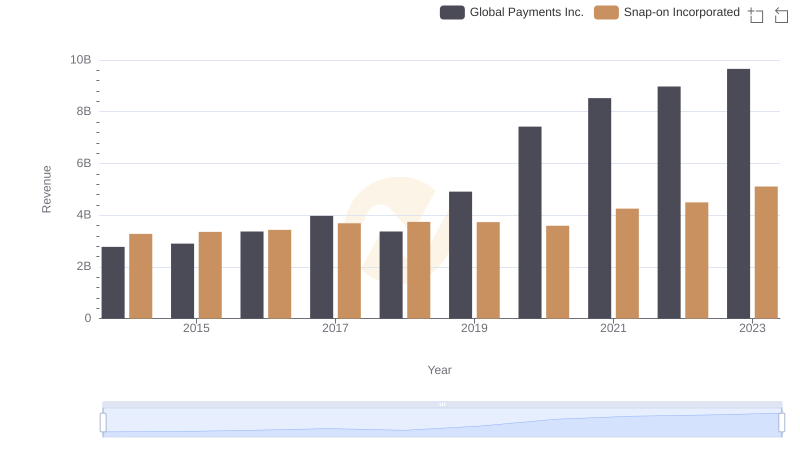
Global Payments Inc. vs Snap-on Incorporated: Examining Key Revenue Metrics
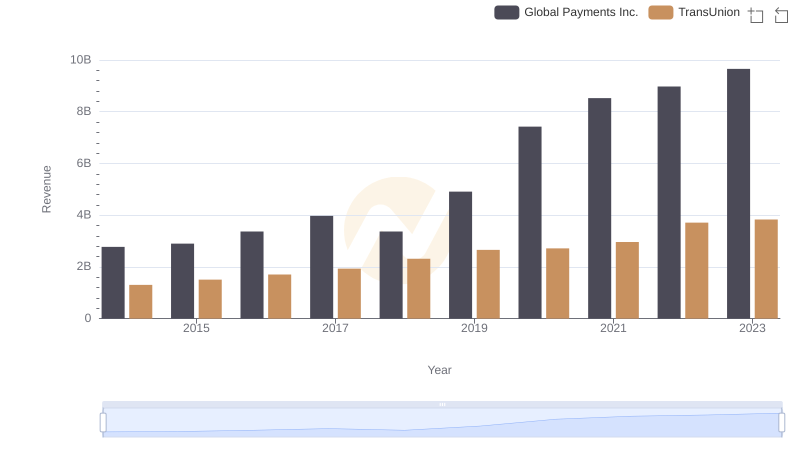
Revenue Insights: Global Payments Inc. and TransUnion Performance Compared
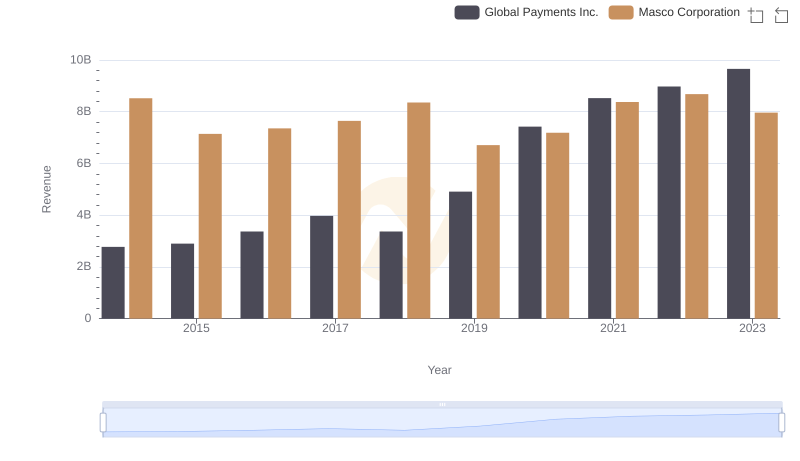
Global Payments Inc. vs Masco Corporation: Examining Key Revenue Metrics
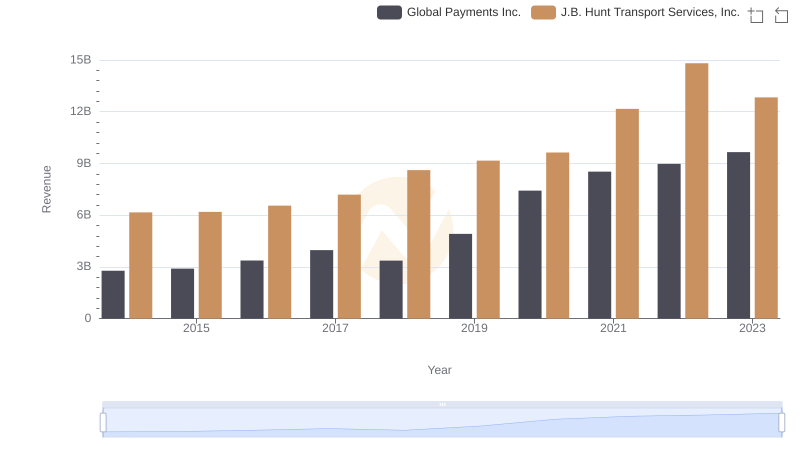
Global Payments Inc. or J.B. Hunt Transport Services, Inc.: Who Leads in Yearly Revenue?
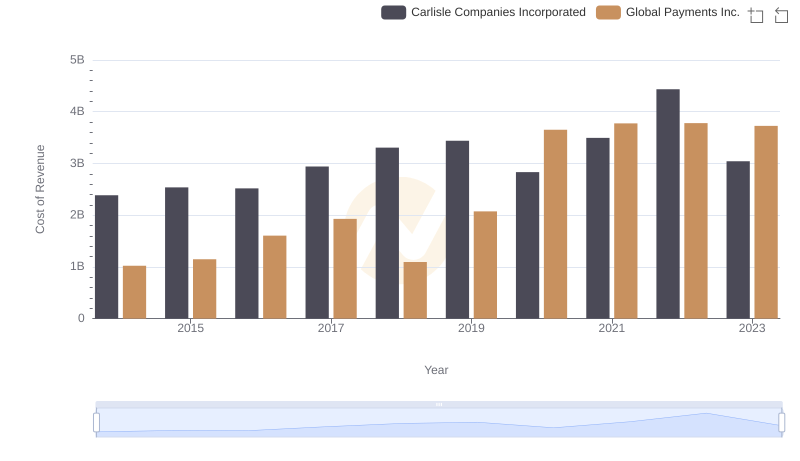
Cost of Revenue Comparison: Global Payments Inc. vs Carlisle Companies Incorporated
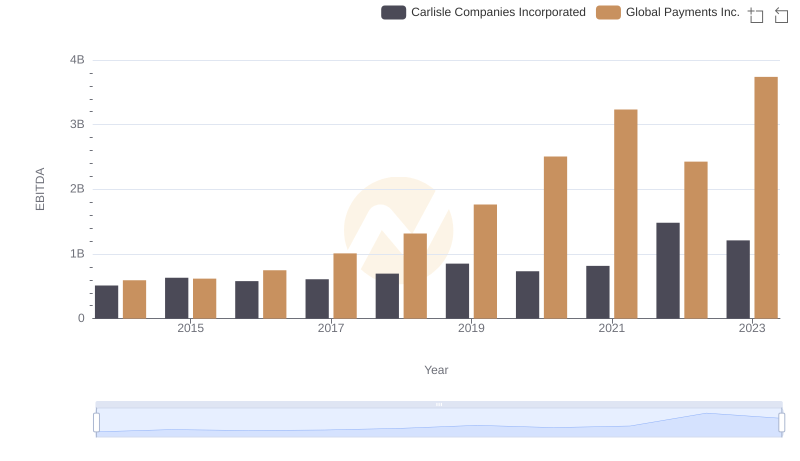
EBITDA Analysis: Evaluating Global Payments Inc. Against Carlisle Companies Incorporated