| __timestamp | Global Payments Inc. | Snap-on Incorporated |
|---|---|---|
| Wednesday, January 1, 2014 | 2773718000 | 3277700000 |
| Thursday, January 1, 2015 | 2898150000 | 3352800000 |
| Friday, January 1, 2016 | 3370976000 | 3430400000 |
| Sunday, January 1, 2017 | 3975163000 | 3686900000 |
| Monday, January 1, 2018 | 3366366000 | 3740700000 |
| Tuesday, January 1, 2019 | 4911892000 | 3730000000 |
| Wednesday, January 1, 2020 | 7423558000 | 3592500000 |
| Friday, January 1, 2021 | 8523762000 | 4252000000 |
| Saturday, January 1, 2022 | 8975515000 | 4492800000 |
| Sunday, January 1, 2023 | 9654419000 | 5108300000 |
| Monday, January 1, 2024 | 10105894000 | 4707400000 |
Infusing magic into the data realm
In the ever-evolving landscape of financial services and manufacturing, Global Payments Inc. and Snap-on Incorporated stand as titans in their respective fields. Over the past decade, Global Payments has seen its revenue soar by an impressive 248%, from approximately $2.8 billion in 2014 to nearly $9.7 billion in 2023. This growth underscores the increasing demand for digital payment solutions worldwide.
Conversely, Snap-on Incorporated, a leader in manufacturing tools and equipment, has experienced a steady revenue increase of about 56% over the same period, reaching over $5.1 billion in 2023. This growth reflects the enduring need for high-quality tools in various industries.
The data reveals a fascinating narrative of growth and adaptation, highlighting how these companies have navigated their respective markets. As we look to the future, the question remains: how will these giants continue to evolve in an ever-changing economic landscape?
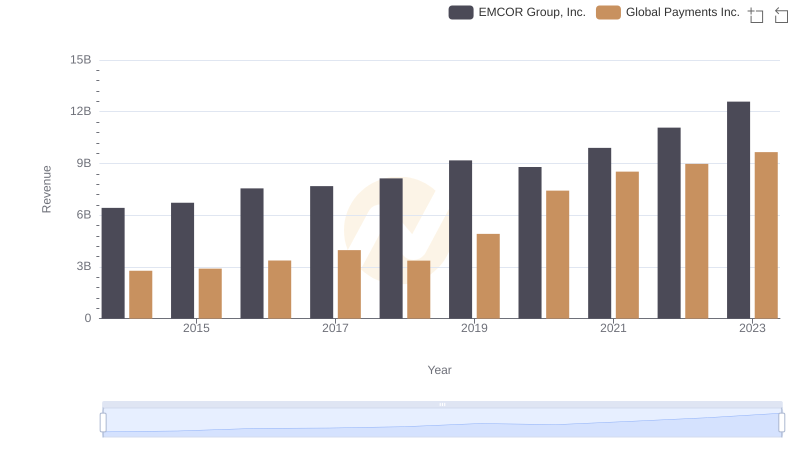
Comparing Revenue Performance: Global Payments Inc. or EMCOR Group, Inc.?
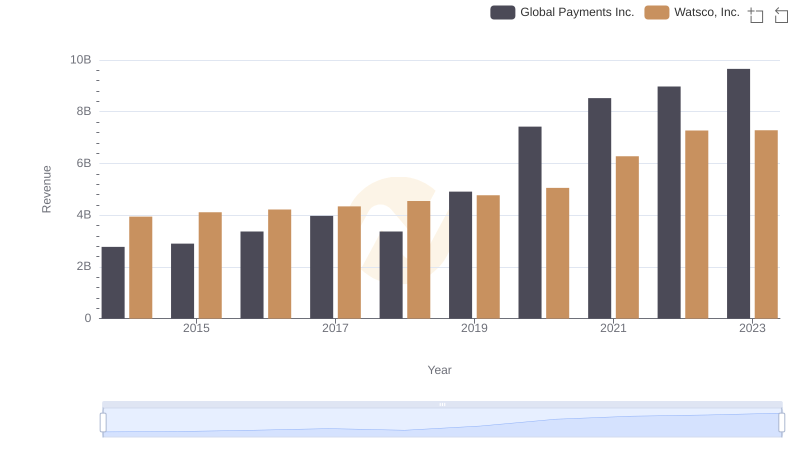
Revenue Showdown: Global Payments Inc. vs Watsco, Inc.
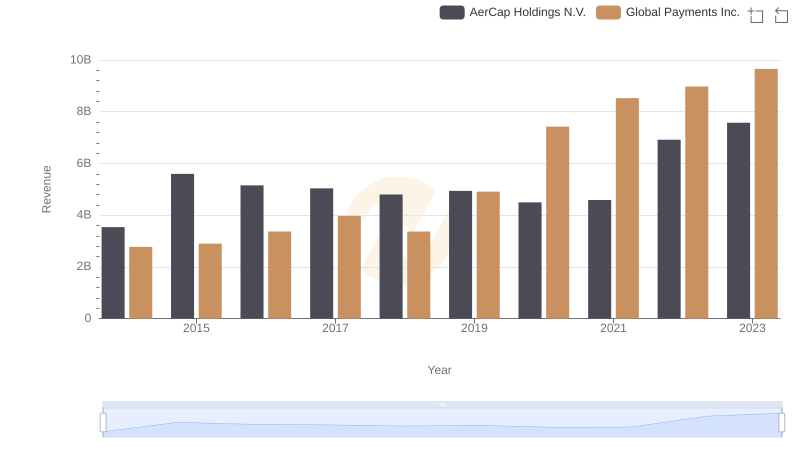
Global Payments Inc. vs AerCap Holdings N.V.: Examining Key Revenue Metrics
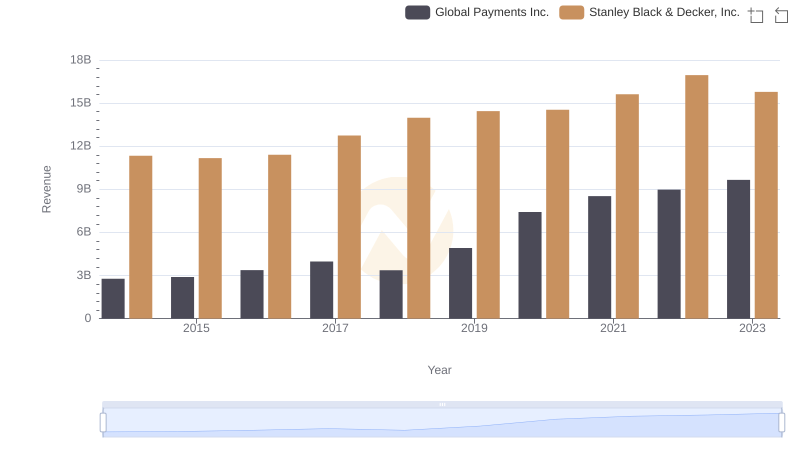
Global Payments Inc. vs Stanley Black & Decker, Inc.: Examining Key Revenue Metrics
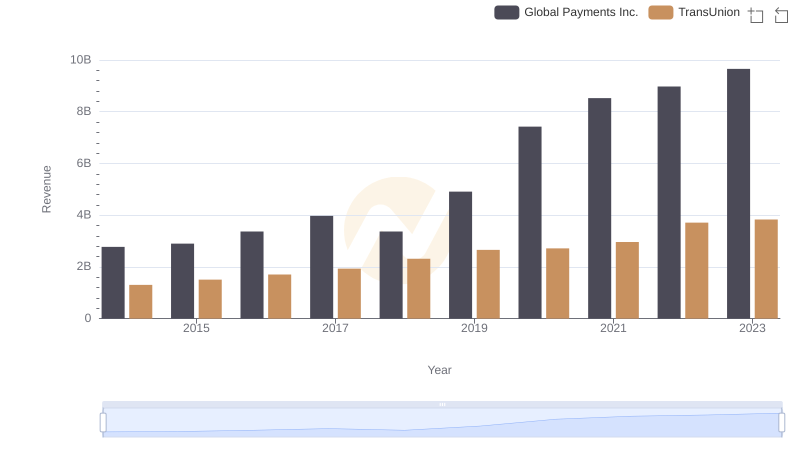
Revenue Insights: Global Payments Inc. and TransUnion Performance Compared
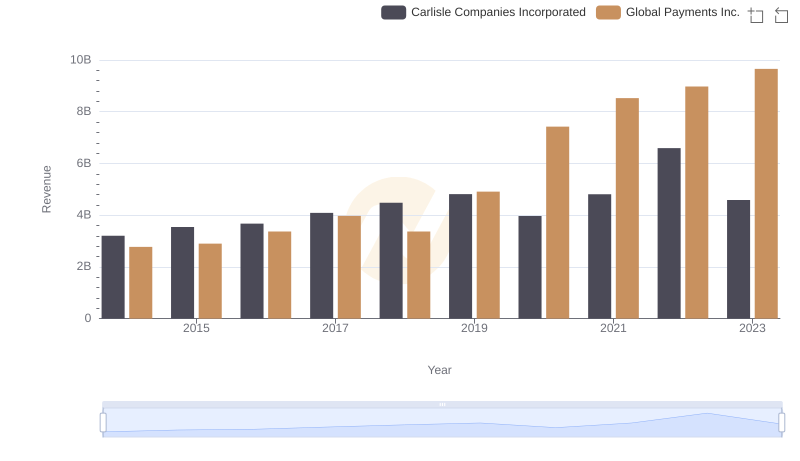
Global Payments Inc. vs Carlisle Companies Incorporated: Examining Key Revenue Metrics
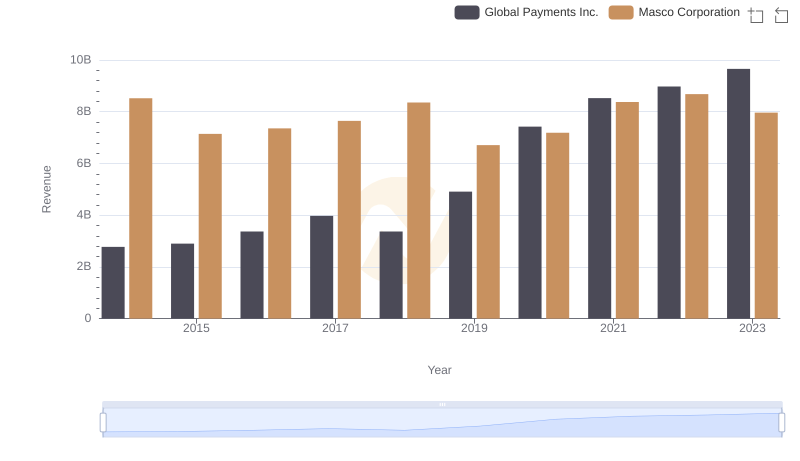
Global Payments Inc. vs Masco Corporation: Examining Key Revenue Metrics
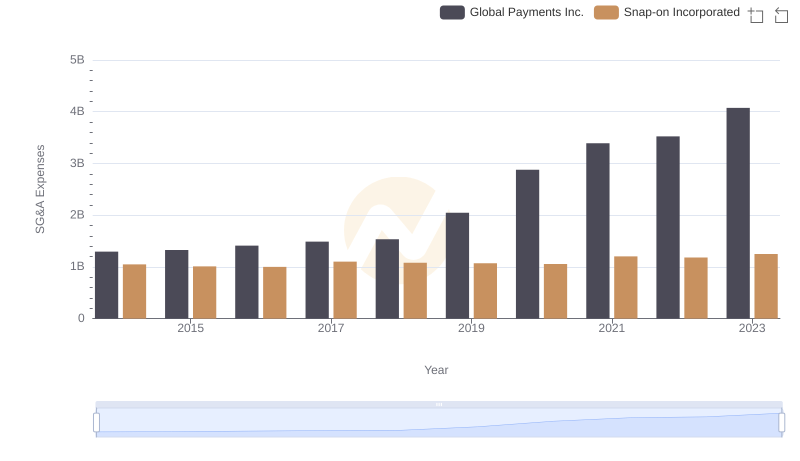
Operational Costs Compared: SG&A Analysis of Global Payments Inc. and Snap-on Incorporated
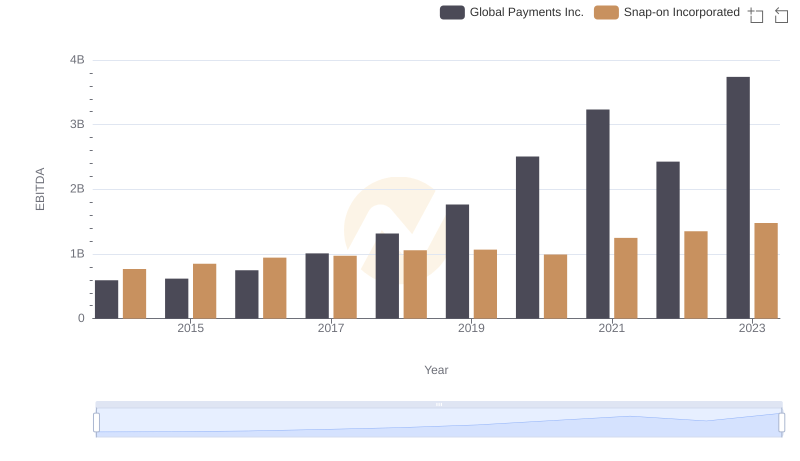
EBITDA Metrics Evaluated: Global Payments Inc. vs Snap-on Incorporated