| __timestamp | Global Payments Inc. | TransUnion |
|---|---|---|
| Wednesday, January 1, 2014 | 2773718000 | 1304700000 |
| Thursday, January 1, 2015 | 2898150000 | 1506800000 |
| Friday, January 1, 2016 | 3370976000 | 1704900000 |
| Sunday, January 1, 2017 | 3975163000 | 1933800000 |
| Monday, January 1, 2018 | 3366366000 | 2317200000 |
| Tuesday, January 1, 2019 | 4911892000 | 2656100000 |
| Wednesday, January 1, 2020 | 7423558000 | 2716600000 |
| Friday, January 1, 2021 | 8523762000 | 2960200000 |
| Saturday, January 1, 2022 | 8975515000 | 3709900000 |
| Sunday, January 1, 2023 | 9654419000 | 3831200000 |
| Monday, January 1, 2024 | 10105894000 | 4183800000 |
Unleashing the power of data
In the ever-evolving landscape of financial services, Global Payments Inc. and TransUnion have emerged as formidable players. Over the past decade, Global Payments Inc. has demonstrated a remarkable revenue growth trajectory, surging by approximately 248% from 2014 to 2023. This growth is a testament to their strategic acquisitions and expansion into new markets. In contrast, TransUnion, a leader in credit reporting, has seen its revenue grow by nearly 193% during the same period, reflecting its robust data analytics capabilities and global reach.
These insights underscore the dynamic nature of the financial services industry, where innovation and adaptability are key to sustained success.
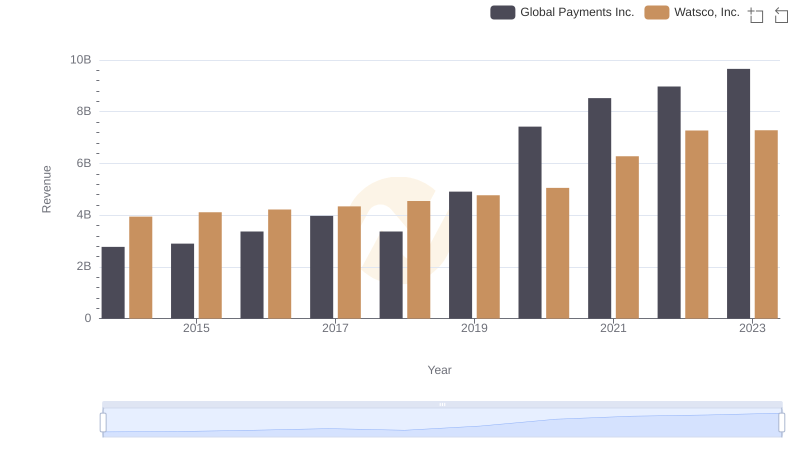
Revenue Showdown: Global Payments Inc. vs Watsco, Inc.
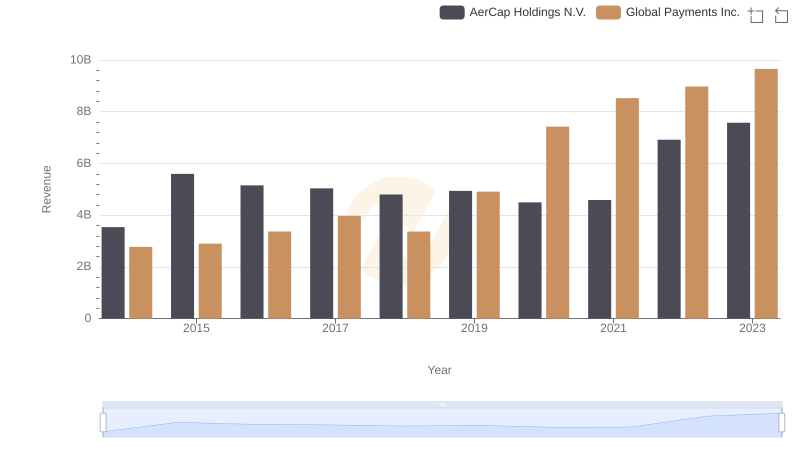
Global Payments Inc. vs AerCap Holdings N.V.: Examining Key Revenue Metrics
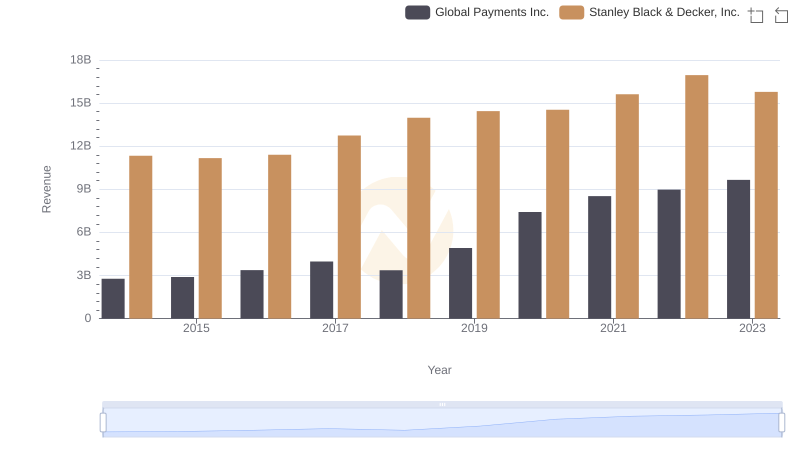
Global Payments Inc. vs Stanley Black & Decker, Inc.: Examining Key Revenue Metrics
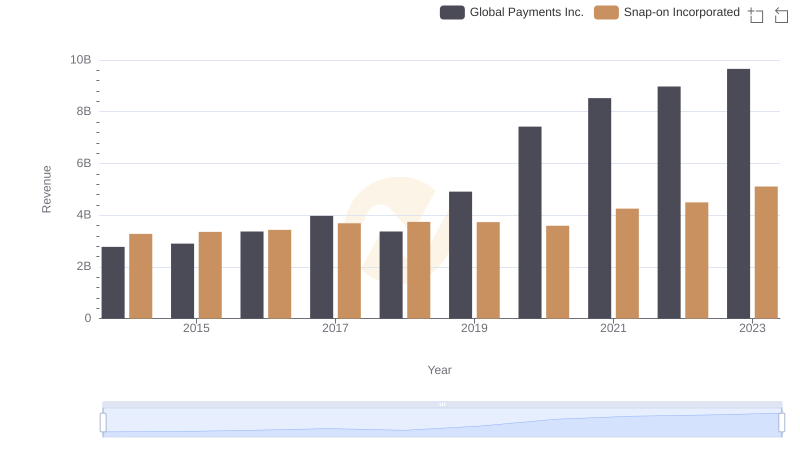
Global Payments Inc. vs Snap-on Incorporated: Examining Key Revenue Metrics
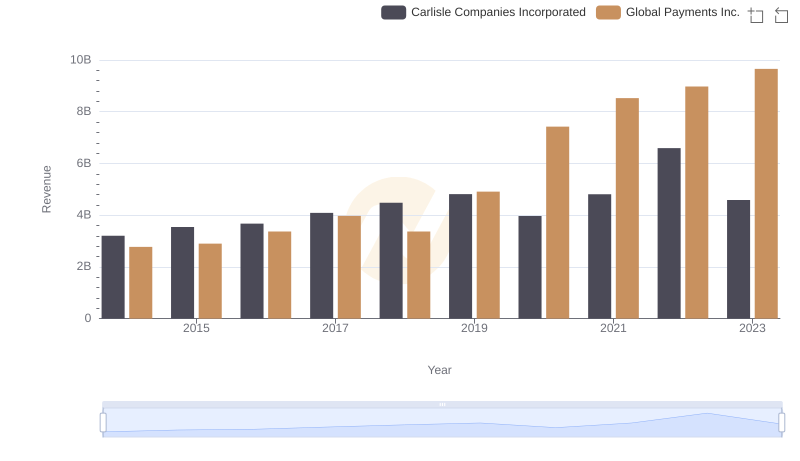
Global Payments Inc. vs Carlisle Companies Incorporated: Examining Key Revenue Metrics
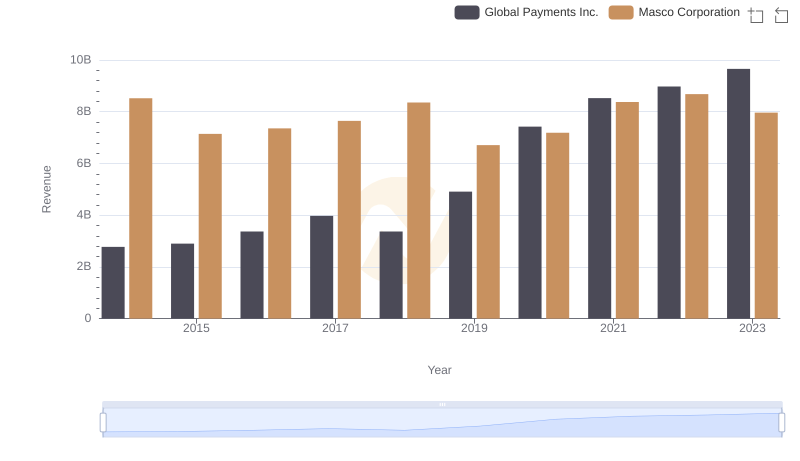
Global Payments Inc. vs Masco Corporation: Examining Key Revenue Metrics
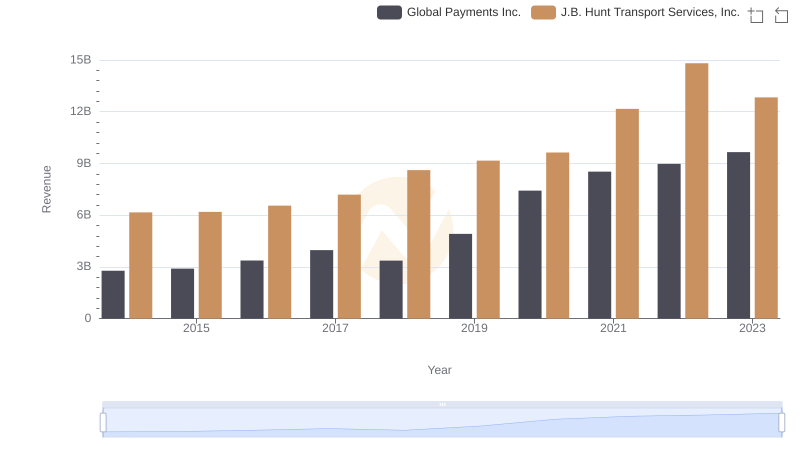
Global Payments Inc. or J.B. Hunt Transport Services, Inc.: Who Leads in Yearly Revenue?
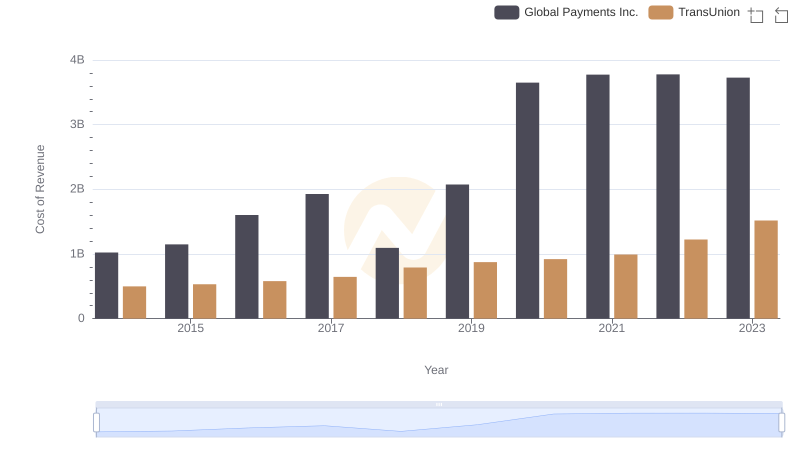
Cost of Revenue Trends: Global Payments Inc. vs TransUnion
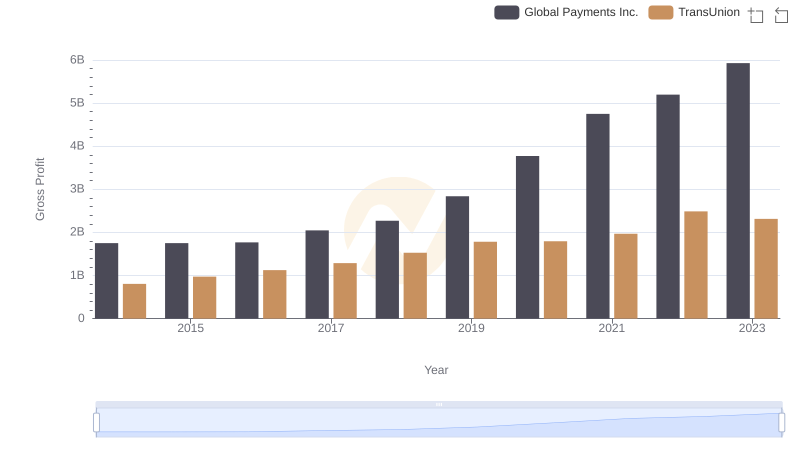
Global Payments Inc. and TransUnion: A Detailed Gross Profit Analysis
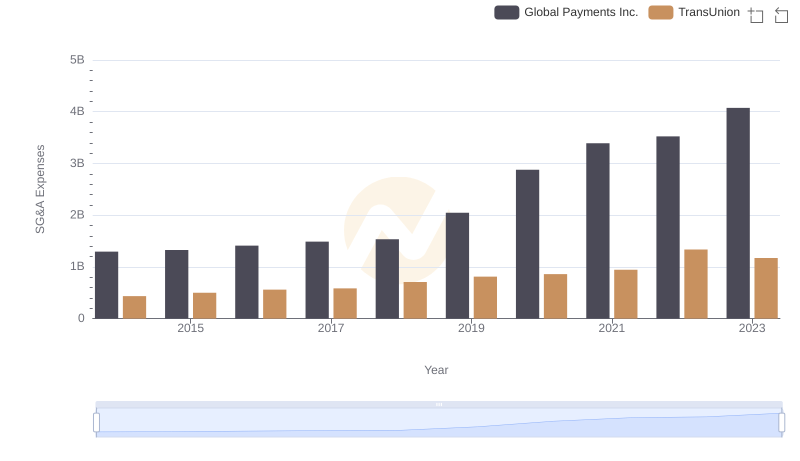
Selling, General, and Administrative Costs: Global Payments Inc. vs TransUnion

Global Payments Inc. vs TransUnion: In-Depth EBITDA Performance Comparison