| __timestamp | Global Payments Inc. | Pentair plc |
|---|---|---|
| Wednesday, January 1, 2014 | 2773718000 | 7039000000 |
| Thursday, January 1, 2015 | 2898150000 | 6449000000 |
| Friday, January 1, 2016 | 3370976000 | 4890000000 |
| Sunday, January 1, 2017 | 3975163000 | 4936500000 |
| Monday, January 1, 2018 | 3366366000 | 2965100000 |
| Tuesday, January 1, 2019 | 4911892000 | 2957200000 |
| Wednesday, January 1, 2020 | 7423558000 | 3017800000 |
| Friday, January 1, 2021 | 8523762000 | 3764800000 |
| Saturday, January 1, 2022 | 8975515000 | 4121800000 |
| Sunday, January 1, 2023 | 9654419000 | 4104500000 |
| Monday, January 1, 2024 | 10105894000 | 4082800000 |
Unlocking the unknown
In the ever-evolving landscape of global commerce, Global Payments Inc. and Pentair plc have showcased contrasting revenue trajectories over the past decade. From 2014 to 2023, Global Payments Inc. has seen a remarkable revenue growth of approximately 248%, starting from $2.77 billion in 2014 and reaching $9.65 billion in 2023. This growth underscores the company's strategic expansions and adaptability in the financial services sector.
Conversely, Pentair plc experienced a more modest revenue journey, with a decline of around 42% from its peak in 2014 at $7.04 billion to $4.10 billion in 2023. This shift reflects the challenges faced in the industrial manufacturing sector, including market fluctuations and evolving consumer demands.
These revenue trends highlight the dynamic nature of business success and the importance of strategic foresight in navigating economic landscapes.
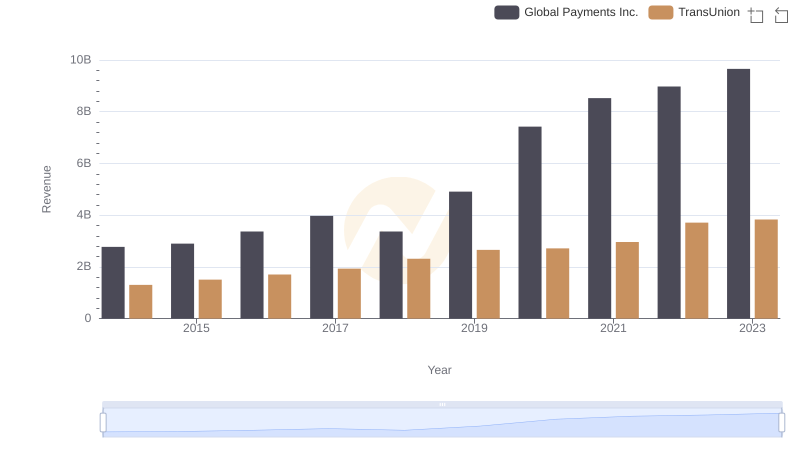
Revenue Insights: Global Payments Inc. and TransUnion Performance Compared
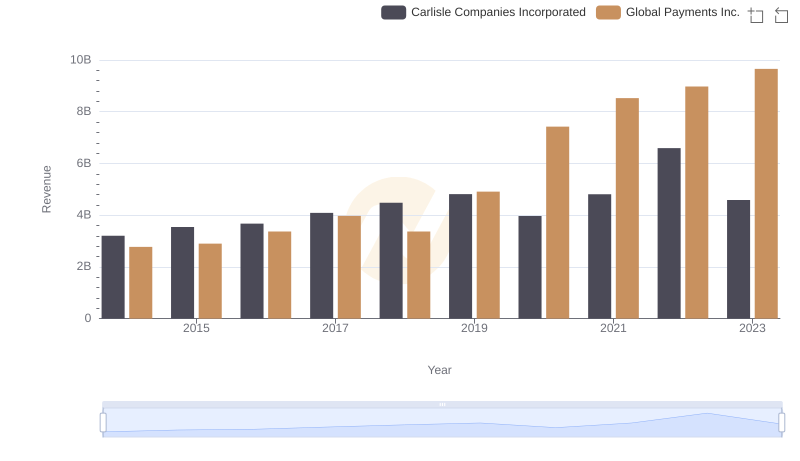
Global Payments Inc. vs Carlisle Companies Incorporated: Examining Key Revenue Metrics
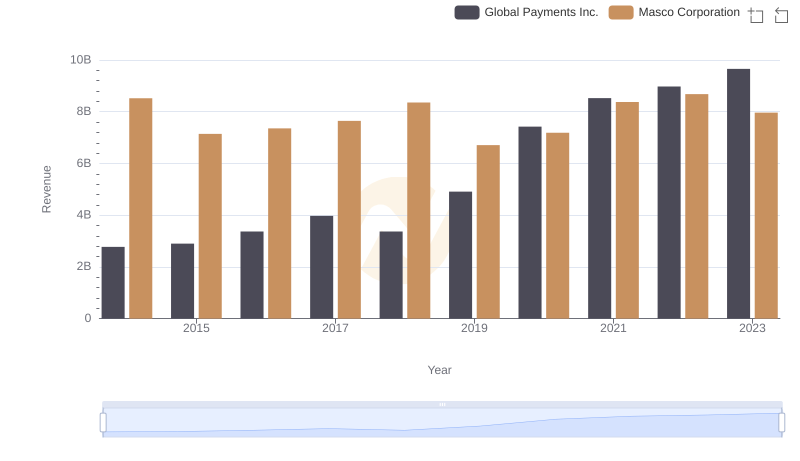
Global Payments Inc. vs Masco Corporation: Examining Key Revenue Metrics
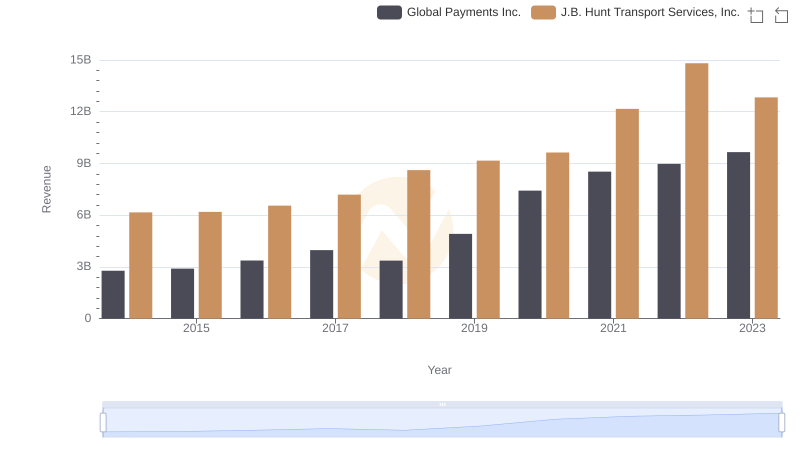
Global Payments Inc. or J.B. Hunt Transport Services, Inc.: Who Leads in Yearly Revenue?
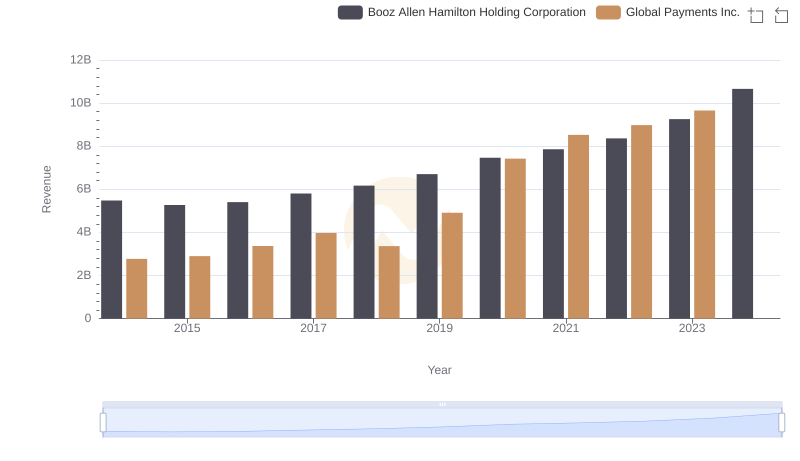
Comparing Revenue Performance: Global Payments Inc. or Booz Allen Hamilton Holding Corporation?
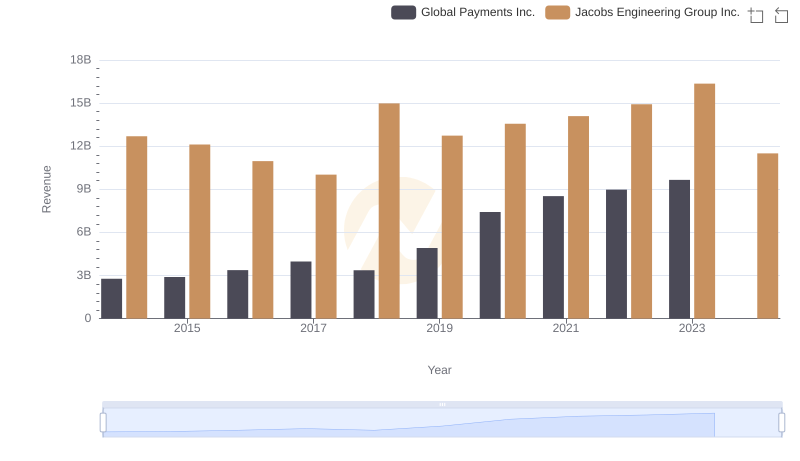
Revenue Insights: Global Payments Inc. and Jacobs Engineering Group Inc. Performance Compared
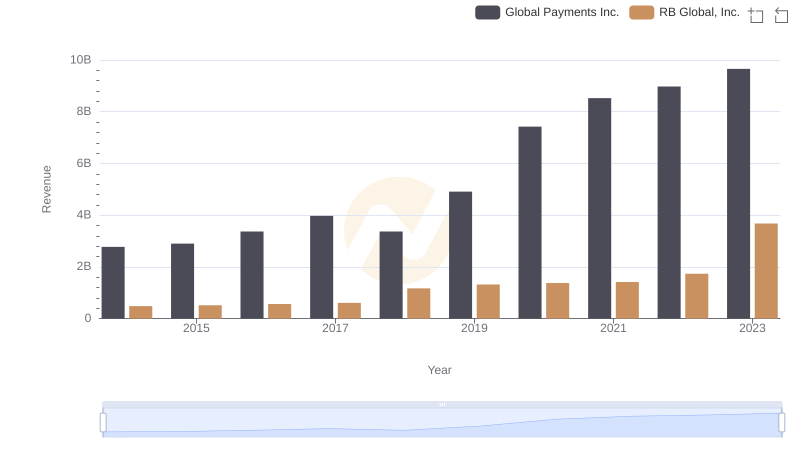
Comparing Revenue Performance: Global Payments Inc. or RB Global, Inc.?
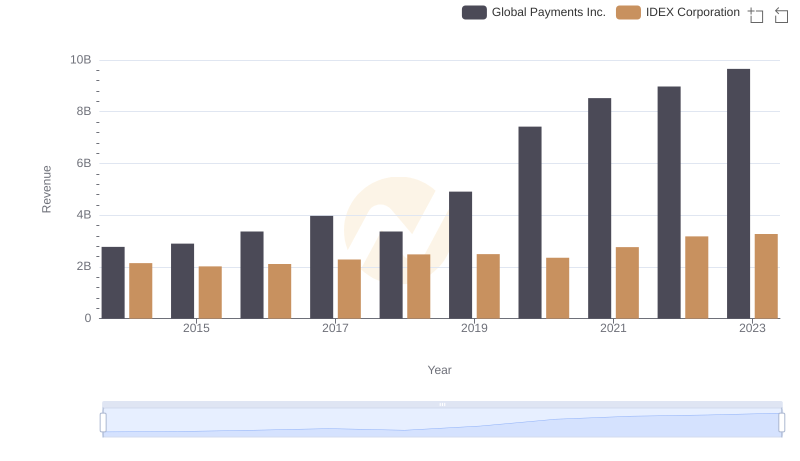
Comparing Revenue Performance: Global Payments Inc. or IDEX Corporation?
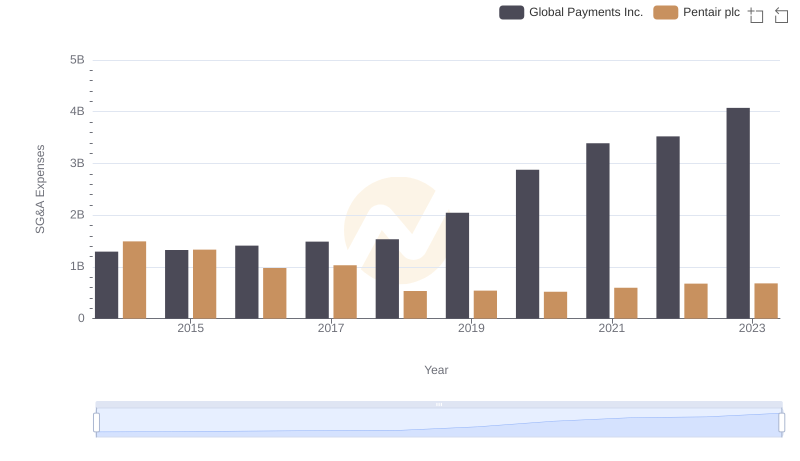
Selling, General, and Administrative Costs: Global Payments Inc. vs Pentair plc
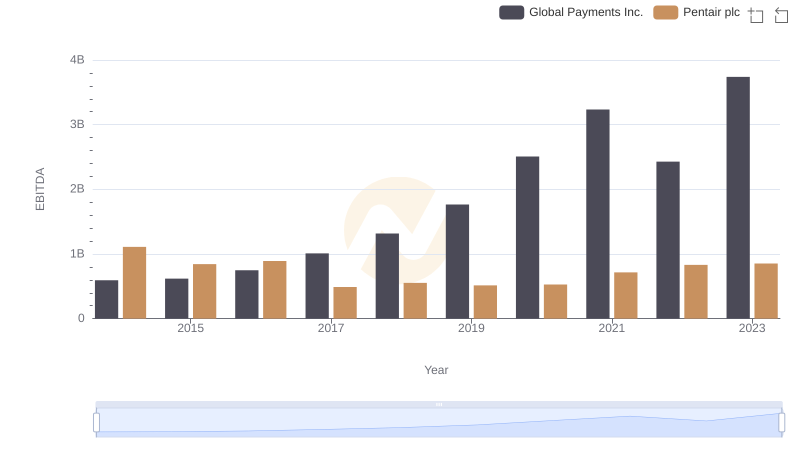
Professional EBITDA Benchmarking: Global Payments Inc. vs Pentair plc