| __timestamp | ITT Inc. | Lennox International Inc. |
|---|---|---|
| Wednesday, January 1, 2014 | 76600000 | 60700000 |
| Thursday, January 1, 2015 | 78900000 | 62300000 |
| Friday, January 1, 2016 | 80800000 | 64599999 |
| Sunday, January 1, 2017 | 93700000 | 73600000 |
| Monday, January 1, 2018 | 98400000 | 72200000 |
| Tuesday, January 1, 2019 | 97900000 | 69900000 |
| Wednesday, January 1, 2020 | 84900000 | 66800000 |
| Friday, January 1, 2021 | 94900000 | 76100000 |
| Saturday, January 1, 2022 | 96500000 | 80300000 |
| Sunday, January 1, 2023 | 102600000 | 94000000 |
| Monday, January 1, 2024 | 116300000 | 0 |
Unveiling the hidden dimensions of data
In the competitive landscape of industrial manufacturing, innovation is key. Over the past decade, ITT Inc. and Lennox International Inc. have been at the forefront of this race. From 2014 to 2023, ITT Inc. consistently outpaced Lennox in research and development (R&D) spending, with an average annual investment of approximately $90 million, compared to Lennox's $65 million. This represents a 38% higher commitment to innovation by ITT Inc.
In 2023, ITT Inc. reached a peak R&D expenditure of $103 million, while Lennox followed closely with $94 million. However, Lennox's data for 2024 is missing, leaving a gap in the trend analysis. This consistent investment by ITT Inc. underscores its strategic focus on innovation, potentially giving it a competitive edge in the market. As the industry evolves, these investments could be pivotal in shaping the future of both companies.
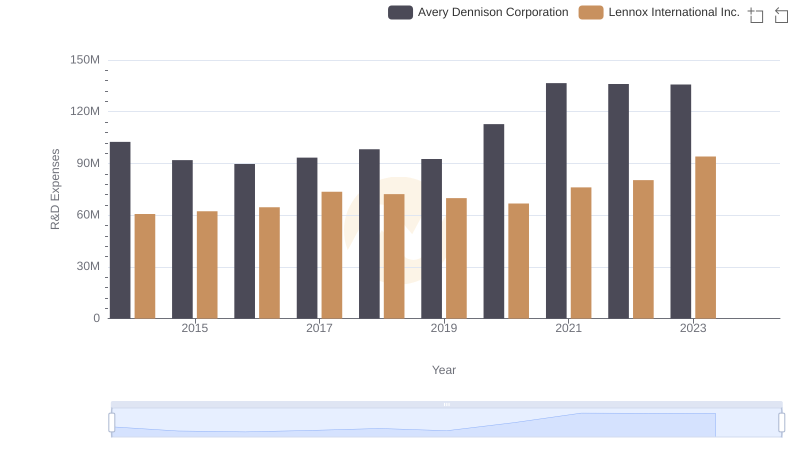
Lennox International Inc. or Avery Dennison Corporation: Who Invests More in Innovation?
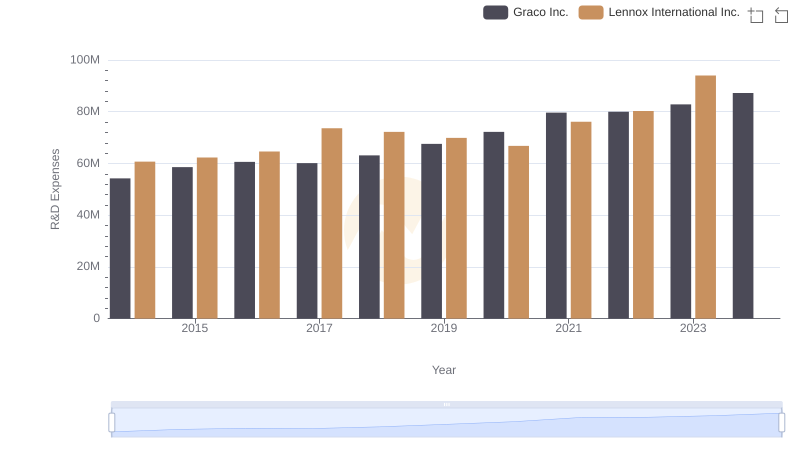
Lennox International Inc. or Graco Inc.: Who Invests More in Innovation?
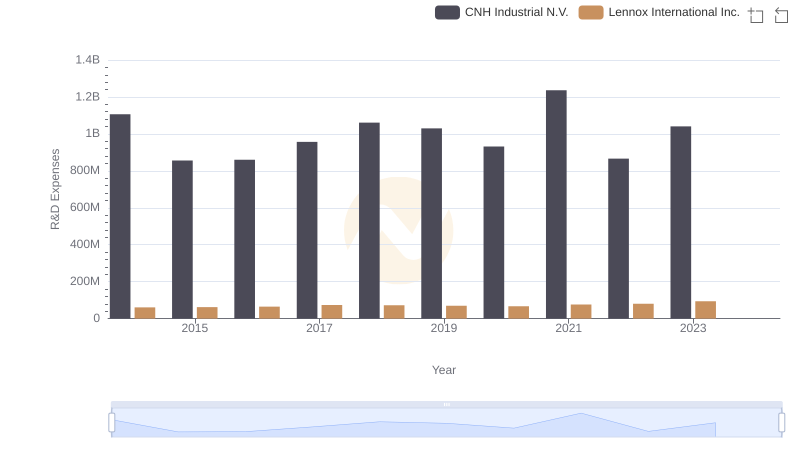
Comparing Innovation Spending: Lennox International Inc. and CNH Industrial N.V.
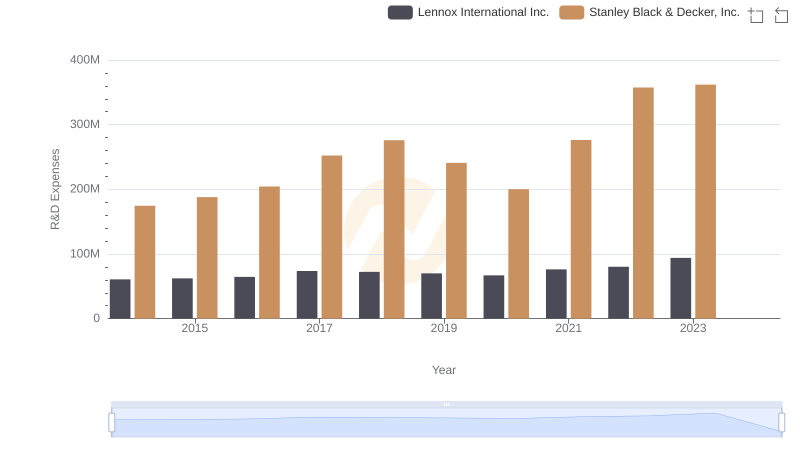
Research and Development: Comparing Key Metrics for Lennox International Inc. and Stanley Black & Decker, Inc.
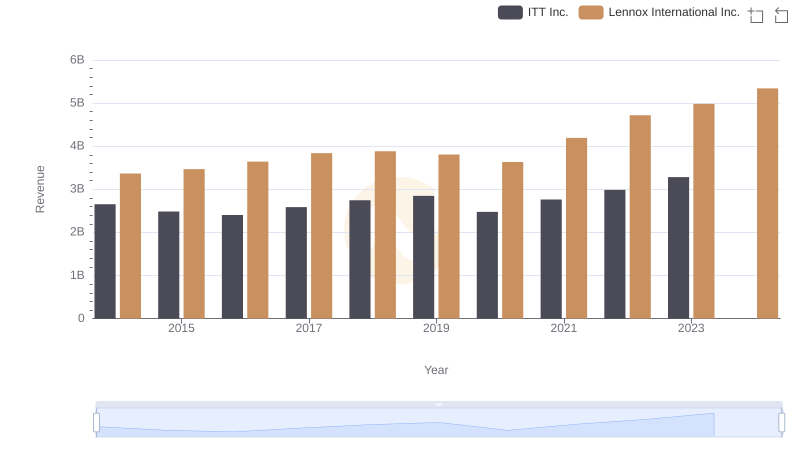
Annual Revenue Comparison: Lennox International Inc. vs ITT Inc.

Cost Insights: Breaking Down Lennox International Inc. and ITT Inc.'s Expenses
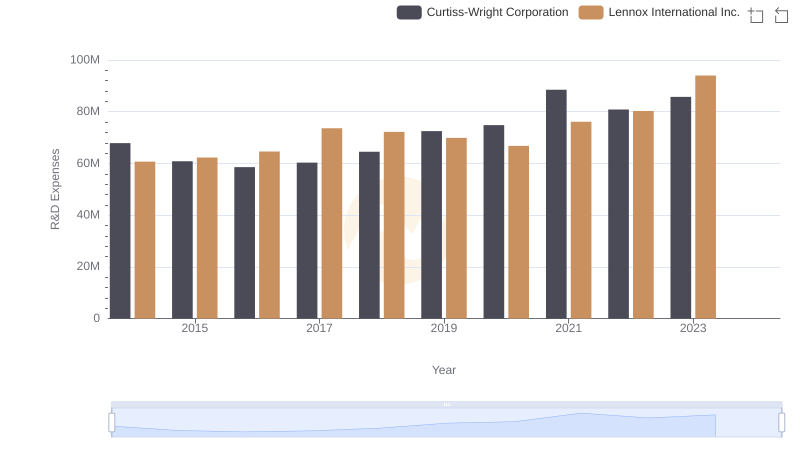
Research and Development Investment: Lennox International Inc. vs Curtiss-Wright Corporation
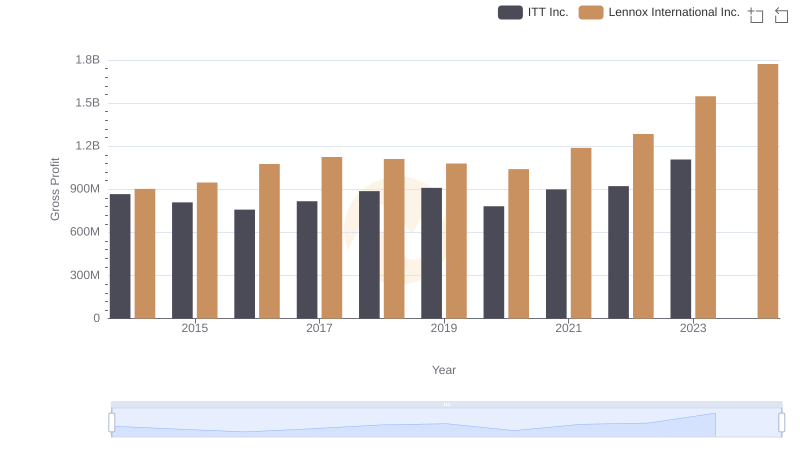
Gross Profit Trends Compared: Lennox International Inc. vs ITT Inc.
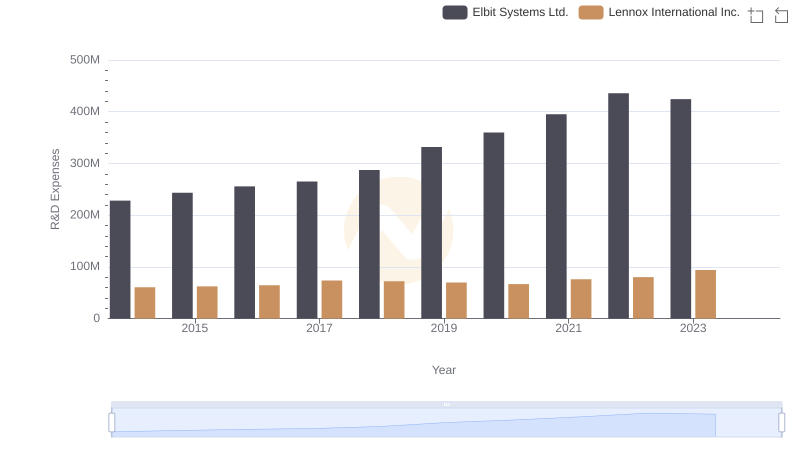
Lennox International Inc. vs Elbit Systems Ltd.: Strategic Focus on R&D Spending
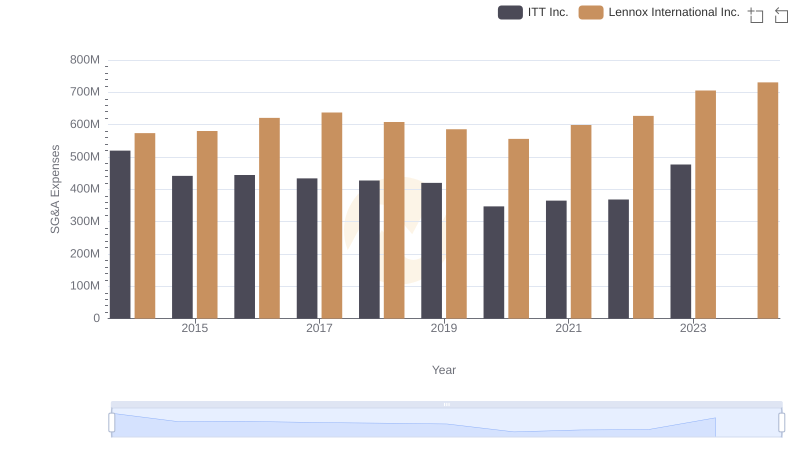
Who Optimizes SG&A Costs Better? Lennox International Inc. or ITT Inc.
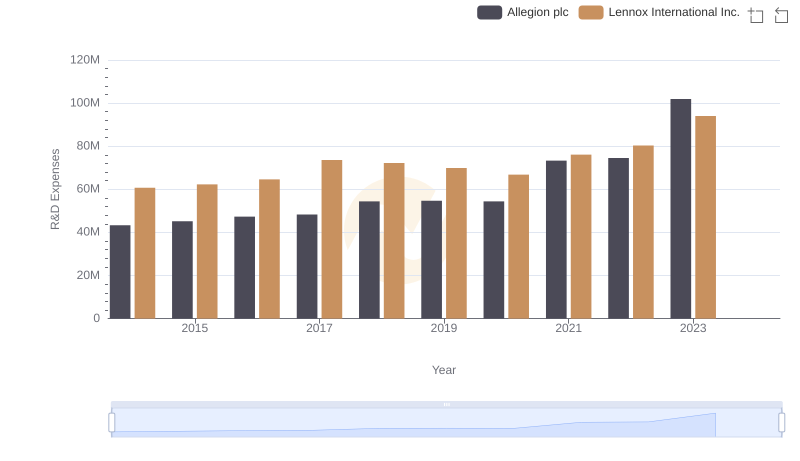
Research and Development: Comparing Key Metrics for Lennox International Inc. and Allegion plc
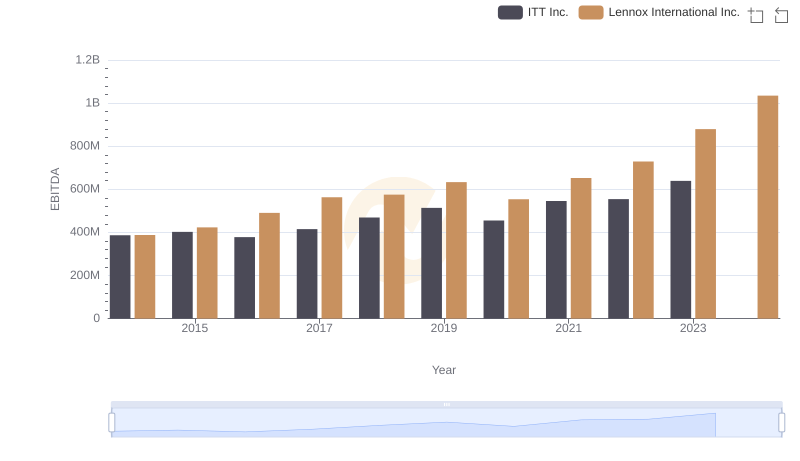
Comprehensive EBITDA Comparison: Lennox International Inc. vs ITT Inc.