| __timestamp | TransDigm Group Incorporated | Waste Management, Inc. |
|---|---|---|
| Wednesday, January 1, 2014 | 892583000 | 3509000000 |
| Thursday, January 1, 2015 | 1157465000 | 3342000000 |
| Friday, January 1, 2016 | 1388030000 | 3713000000 |
| Sunday, January 1, 2017 | 1616889000 | 3996000000 |
| Monday, January 1, 2018 | 1654961000 | 4212000000 |
| Tuesday, January 1, 2019 | 2153332000 | 4344000000 |
| Wednesday, January 1, 2020 | 2046000000 | 4149000000 |
| Friday, January 1, 2021 | 2065000000 | 4956000000 |
| Saturday, January 1, 2022 | 2457000000 | 5466000000 |
| Sunday, January 1, 2023 | 3212000000 | 5592000000 |
| Monday, January 1, 2024 | 3869000000 | 5128000000 |
Unveiling the hidden dimensions of data
In the world of corporate finance, EBITDA serves as a crucial indicator of a company's operational performance. Over the past decade, Waste Management, Inc. and TransDigm Group Incorporated have showcased intriguing trajectories in their EBITDA growth. From 2014 to 2023, Waste Management's EBITDA surged by approximately 59%, peaking in 2023. Meanwhile, TransDigm Group exhibited an even more dramatic rise, with a staggering 333% increase over the same period. This growth highlights TransDigm's aggressive expansion and strategic acquisitions. However, it's noteworthy that Waste Management consistently maintained higher EBITDA figures, underscoring its robust market position. The data for 2024 remains incomplete, leaving room for speculation on future trends. As these industry titans continue to evolve, their financial narratives offer valuable insights into strategic business maneuvers and market dynamics.
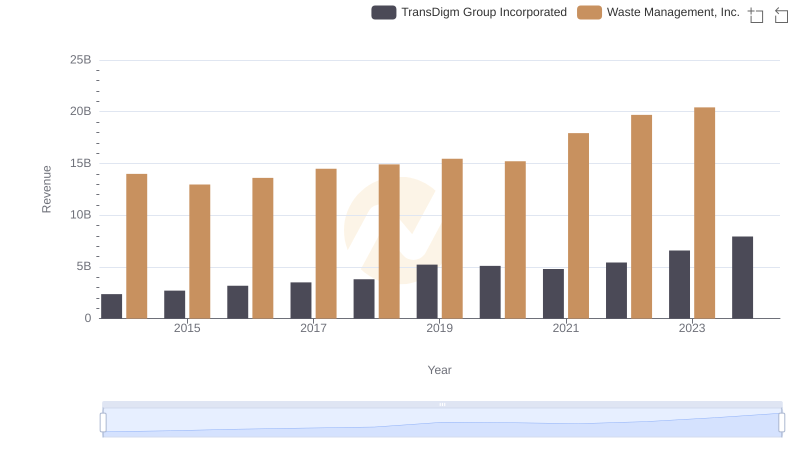
Breaking Down Revenue Trends: Waste Management, Inc. vs TransDigm Group Incorporated
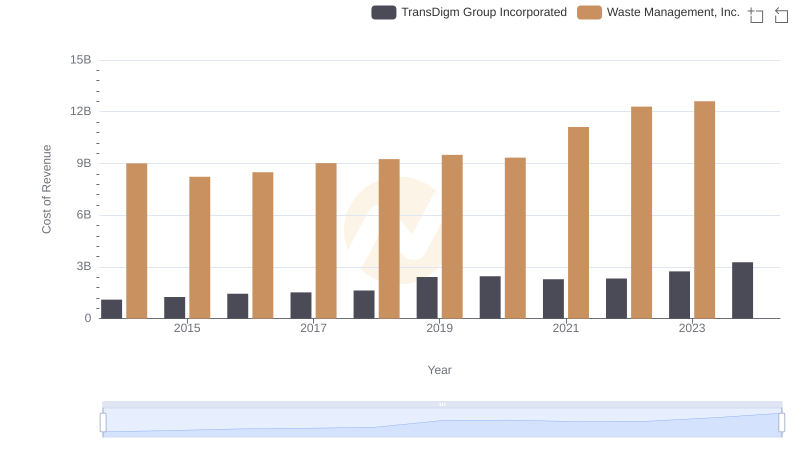
Cost of Revenue: Key Insights for Waste Management, Inc. and TransDigm Group Incorporated
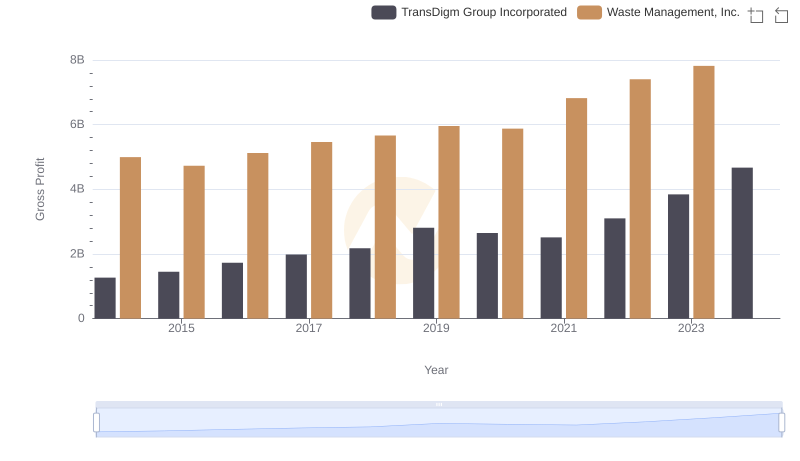
Gross Profit Analysis: Comparing Waste Management, Inc. and TransDigm Group Incorporated
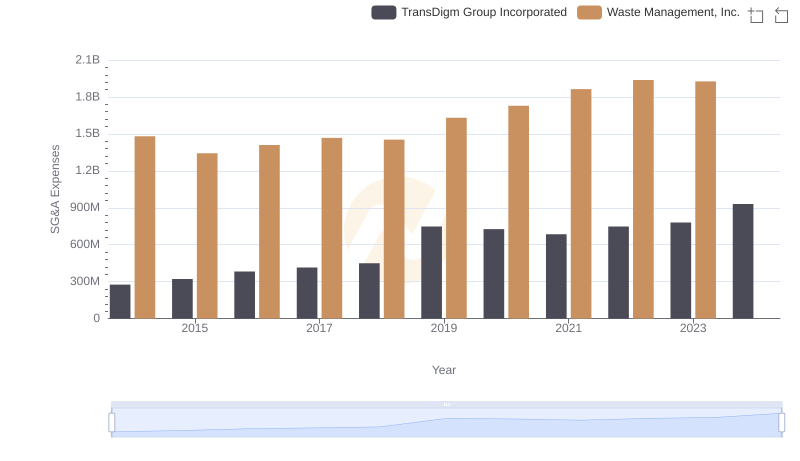
Waste Management, Inc. and TransDigm Group Incorporated: SG&A Spending Patterns Compared
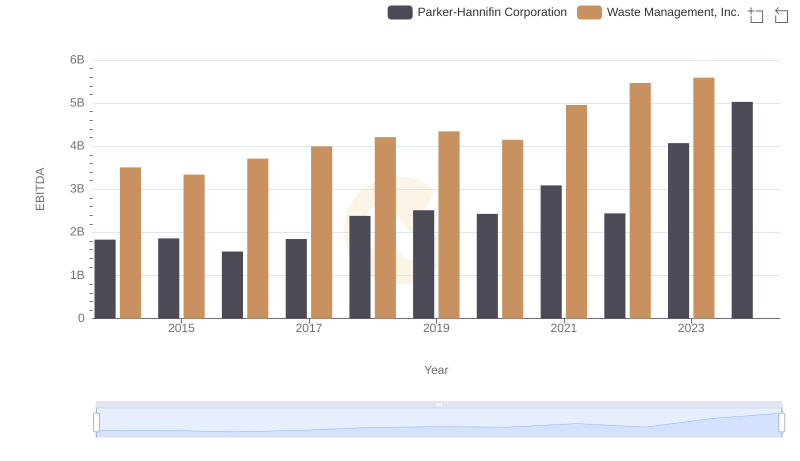
EBITDA Analysis: Evaluating Waste Management, Inc. Against Parker-Hannifin Corporation
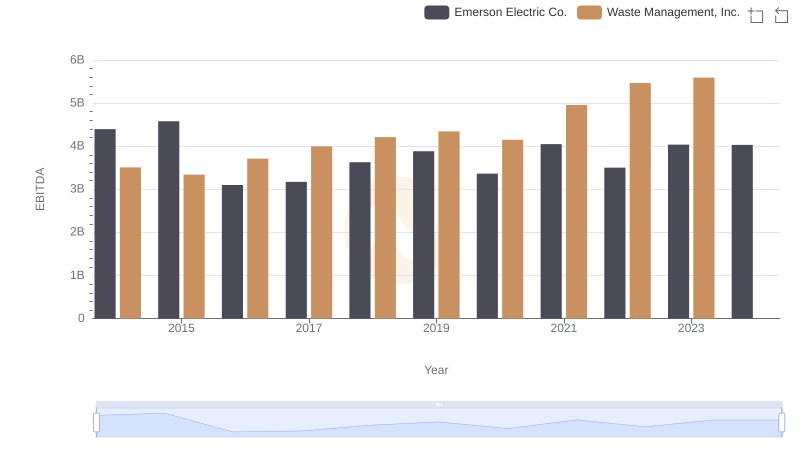
A Side-by-Side Analysis of EBITDA: Waste Management, Inc. and Emerson Electric Co.
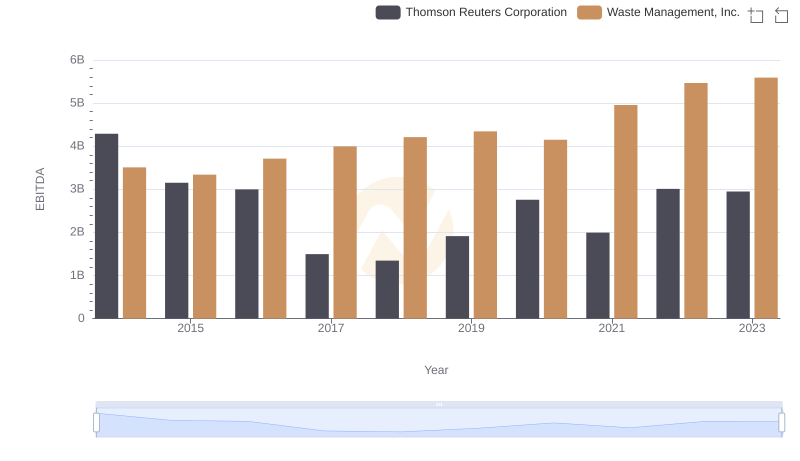
EBITDA Performance Review: Waste Management, Inc. vs Thomson Reuters Corporation

Professional EBITDA Benchmarking: Waste Management, Inc. vs FedEx Corporation
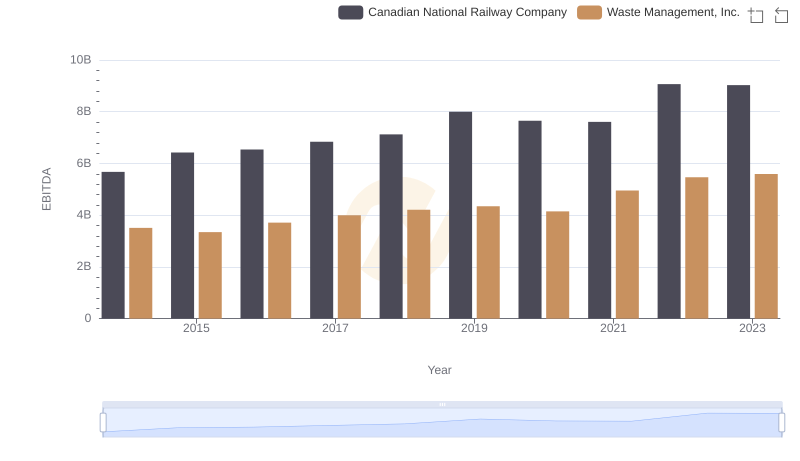
Comparative EBITDA Analysis: Waste Management, Inc. vs Canadian National Railway Company
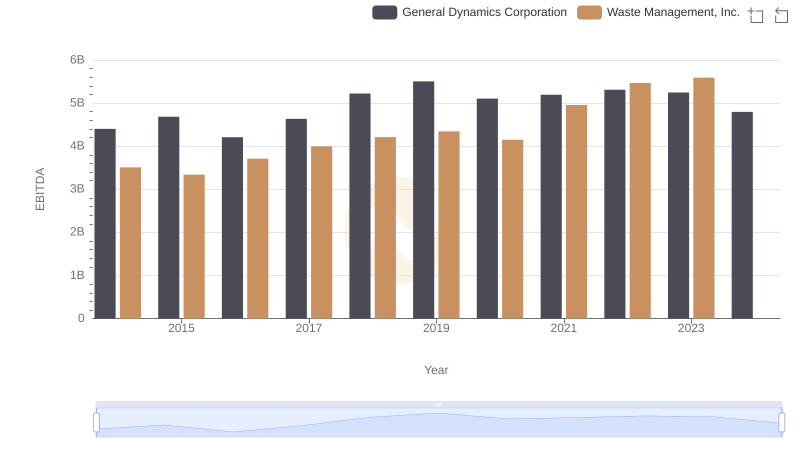
Comprehensive EBITDA Comparison: Waste Management, Inc. vs General Dynamics Corporation