| __timestamp | Parker-Hannifin Corporation | Waste Management, Inc. |
|---|---|---|
| Wednesday, January 1, 2014 | 1832903000 | 3509000000 |
| Thursday, January 1, 2015 | 1861551000 | 3342000000 |
| Friday, January 1, 2016 | 1558088000 | 3713000000 |
| Sunday, January 1, 2017 | 1846306000 | 3996000000 |
| Monday, January 1, 2018 | 2382235000 | 4212000000 |
| Tuesday, January 1, 2019 | 2513468000 | 4344000000 |
| Wednesday, January 1, 2020 | 2431500000 | 4149000000 |
| Friday, January 1, 2021 | 3092383000 | 4956000000 |
| Saturday, January 1, 2022 | 2441242000 | 5466000000 |
| Sunday, January 1, 2023 | 4071687000 | 5592000000 |
| Monday, January 1, 2024 | 5028229000 | 5128000000 |
Unveiling the hidden dimensions of data
In the ever-evolving landscape of industrial giants, Waste Management, Inc. and Parker-Hannifin Corporation have consistently demonstrated their financial prowess. Over the past decade, Waste Management has shown a steady EBITDA growth, peaking at approximately 5.6 billion in 2023, marking a 60% increase since 2014. In contrast, Parker-Hannifin's EBITDA surged by over 170% during the same period, reaching a remarkable 5 billion in 2024. This growth trajectory highlights Parker-Hannifin's strategic adaptability and market resilience.
While Waste Management's EBITDA remained robust, Parker-Hannifin's recent leap underscores its aggressive expansion and operational efficiency. However, the absence of data for Waste Management in 2024 leaves room for speculation about its future performance. As these industry leaders continue to innovate, their financial strategies will be pivotal in shaping the competitive landscape.
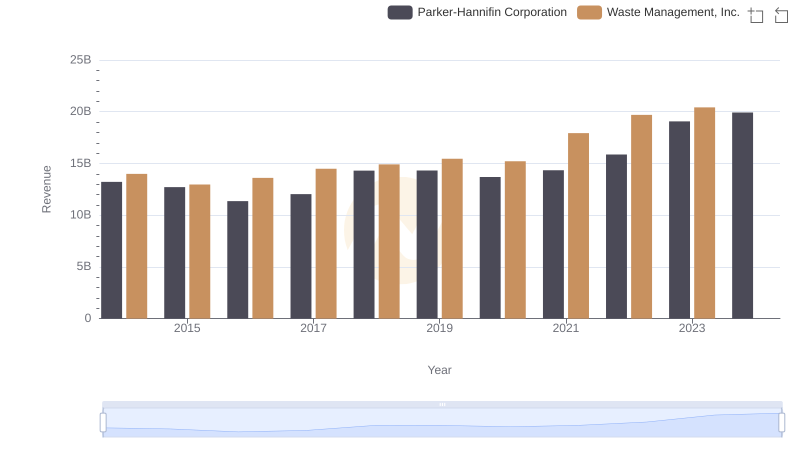
Waste Management, Inc. and Parker-Hannifin Corporation: A Comprehensive Revenue Analysis
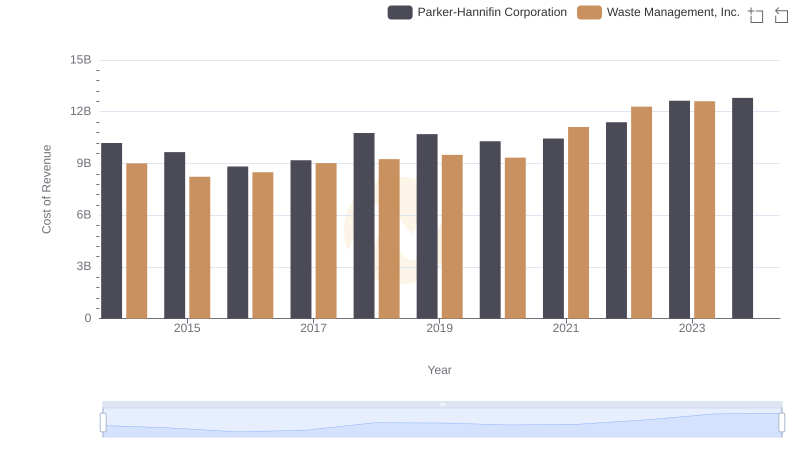
Cost Insights: Breaking Down Waste Management, Inc. and Parker-Hannifin Corporation's Expenses
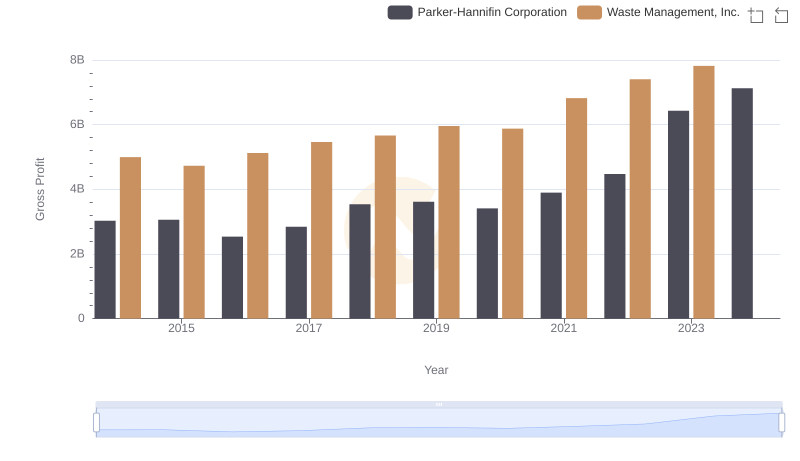
Who Generates Higher Gross Profit? Waste Management, Inc. or Parker-Hannifin Corporation
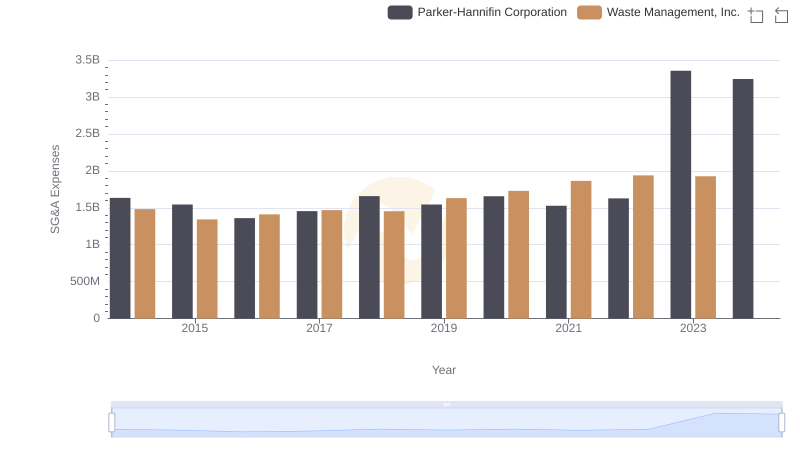
Operational Costs Compared: SG&A Analysis of Waste Management, Inc. and Parker-Hannifin Corporation
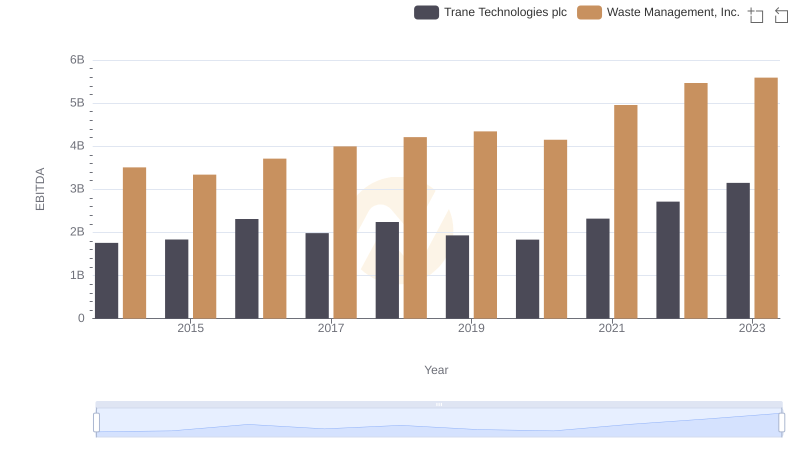
Professional EBITDA Benchmarking: Waste Management, Inc. vs Trane Technologies plc
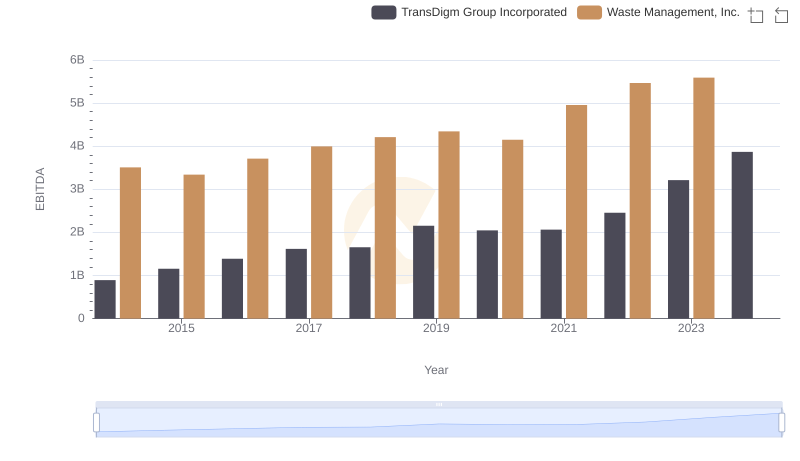
Waste Management, Inc. vs TransDigm Group Incorporated: In-Depth EBITDA Performance Comparison
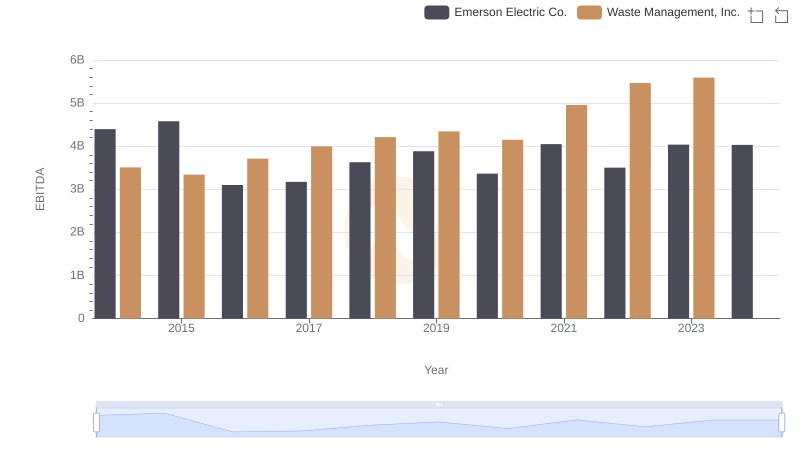
A Side-by-Side Analysis of EBITDA: Waste Management, Inc. and Emerson Electric Co.
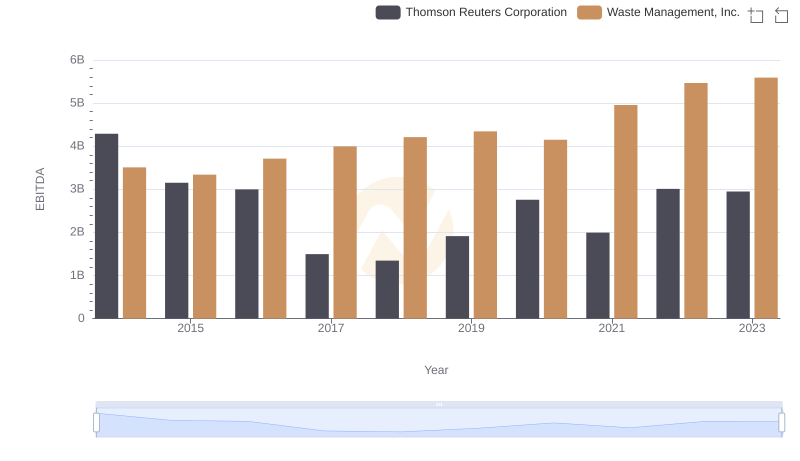
EBITDA Performance Review: Waste Management, Inc. vs Thomson Reuters Corporation

Professional EBITDA Benchmarking: Waste Management, Inc. vs FedEx Corporation
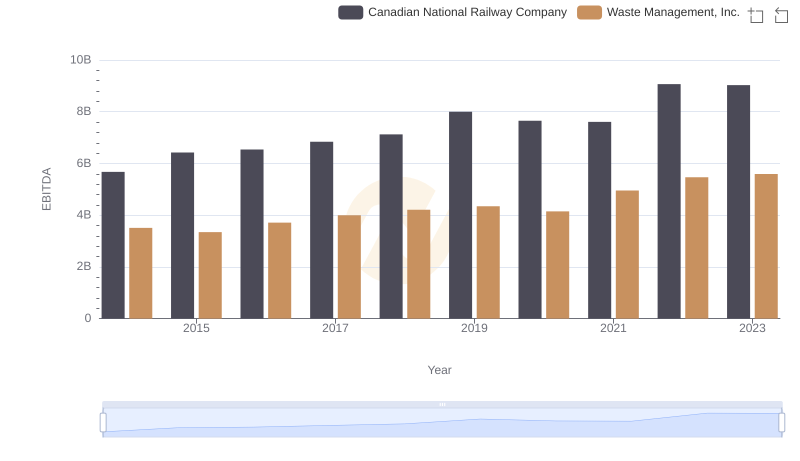
Comparative EBITDA Analysis: Waste Management, Inc. vs Canadian National Railway Company