| __timestamp | Snap-on Incorporated | Waste Management, Inc. |
|---|---|---|
| Wednesday, January 1, 2014 | 3277700000 | 13996000000 |
| Thursday, January 1, 2015 | 3352800000 | 12961000000 |
| Friday, January 1, 2016 | 3430400000 | 13609000000 |
| Sunday, January 1, 2017 | 3686900000 | 14485000000 |
| Monday, January 1, 2018 | 3740700000 | 14914000000 |
| Tuesday, January 1, 2019 | 3730000000 | 15455000000 |
| Wednesday, January 1, 2020 | 3592500000 | 15218000000 |
| Friday, January 1, 2021 | 4252000000 | 17931000000 |
| Saturday, January 1, 2022 | 4492800000 | 19698000000 |
| Sunday, January 1, 2023 | 5108300000 | 20426000000 |
| Monday, January 1, 2024 | 4707400000 | 22063000000 |
Igniting the spark of knowledge
In the ever-evolving landscape of American industry, Waste Management, Inc. and Snap-on Incorporated have emerged as stalwarts of their respective sectors. Over the past decade, from 2014 to 2023, these companies have demonstrated remarkable revenue trajectories. Waste Management, Inc., a leader in environmental services, has seen its revenue grow by approximately 46%, reaching a peak in 2023. This growth underscores the increasing importance of sustainable waste solutions in today's world. Meanwhile, Snap-on Incorporated, a key player in the manufacturing of tools and equipment, has experienced a revenue increase of around 56% over the same period. This surge highlights the enduring demand for high-quality tools in various industries. As we delve into this comprehensive revenue analysis, it becomes evident that both companies are not only surviving but thriving, adapting to the changing demands of the 21st-century market.
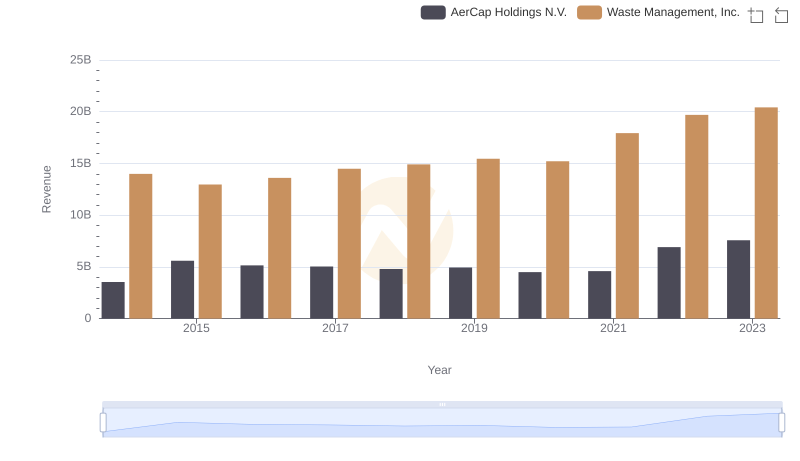
Annual Revenue Comparison: Waste Management, Inc. vs AerCap Holdings N.V.
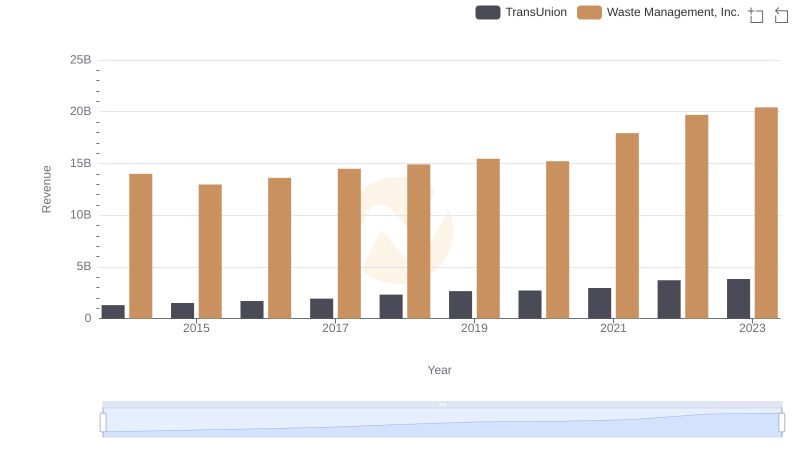
Waste Management, Inc. and TransUnion: A Comprehensive Revenue Analysis

Waste Management, Inc. vs Carlisle Companies Incorporated: Examining Key Revenue Metrics
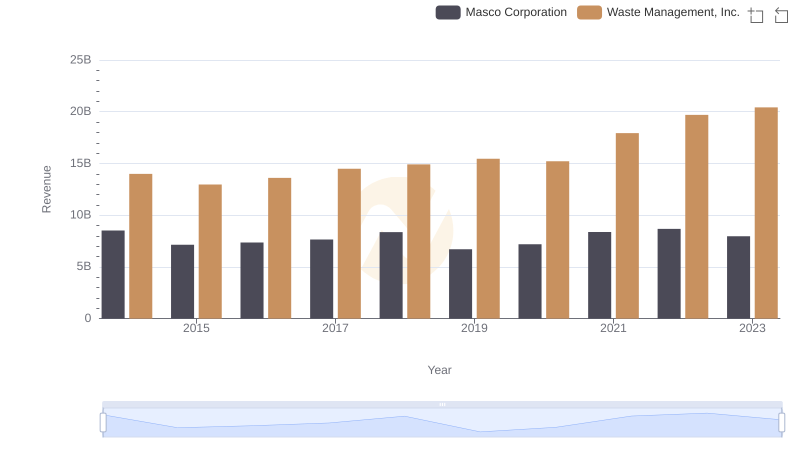
Revenue Showdown: Waste Management, Inc. vs Masco Corporation
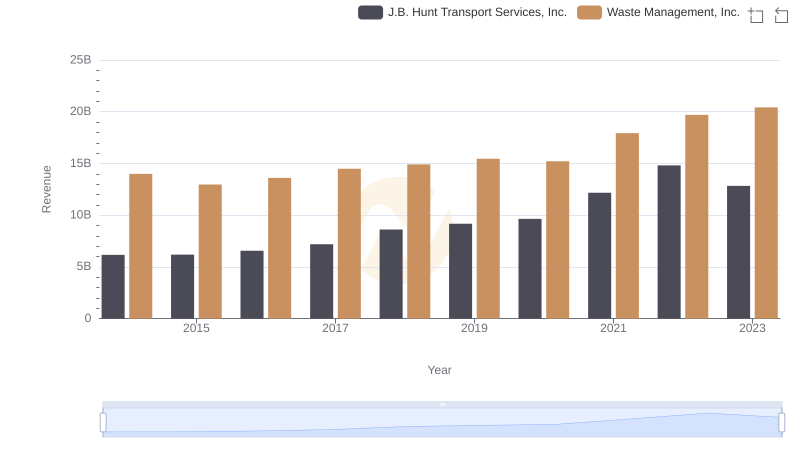
Waste Management, Inc. or J.B. Hunt Transport Services, Inc.: Who Leads in Yearly Revenue?
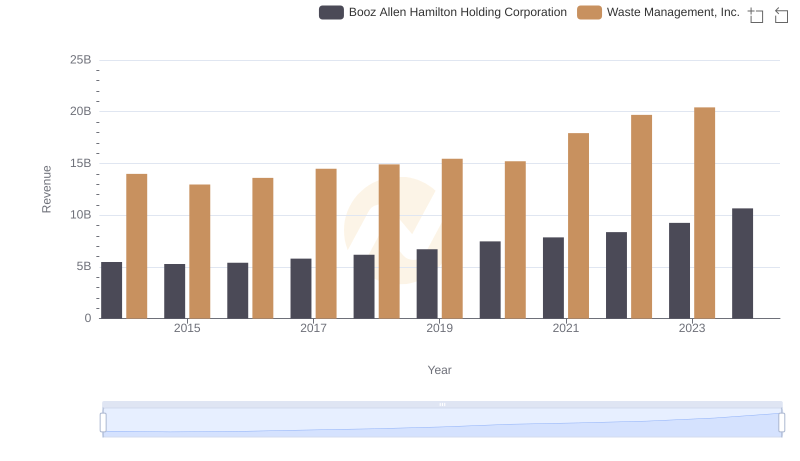
Breaking Down Revenue Trends: Waste Management, Inc. vs Booz Allen Hamilton Holding Corporation
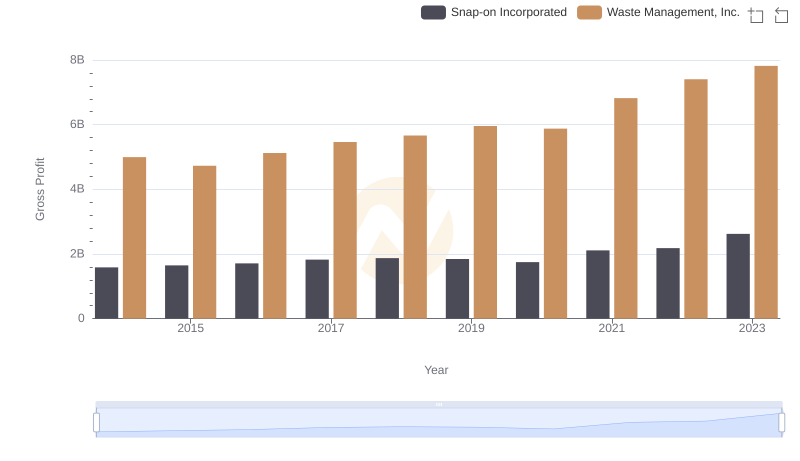
Waste Management, Inc. and Snap-on Incorporated: A Detailed Gross Profit Analysis
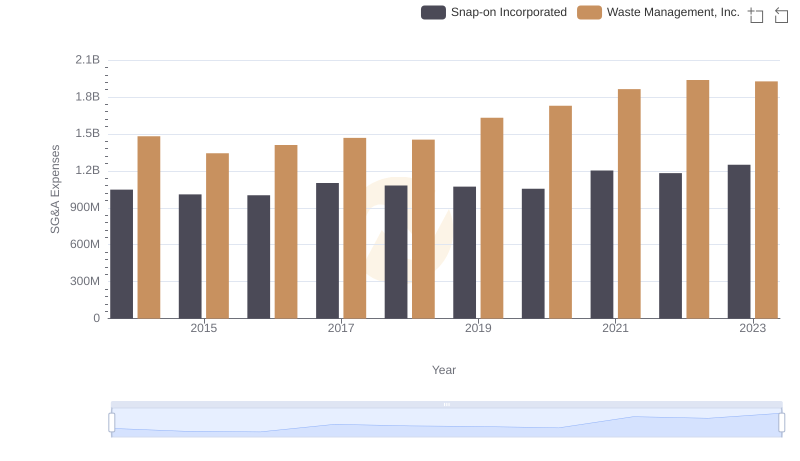
Operational Costs Compared: SG&A Analysis of Waste Management, Inc. and Snap-on Incorporated
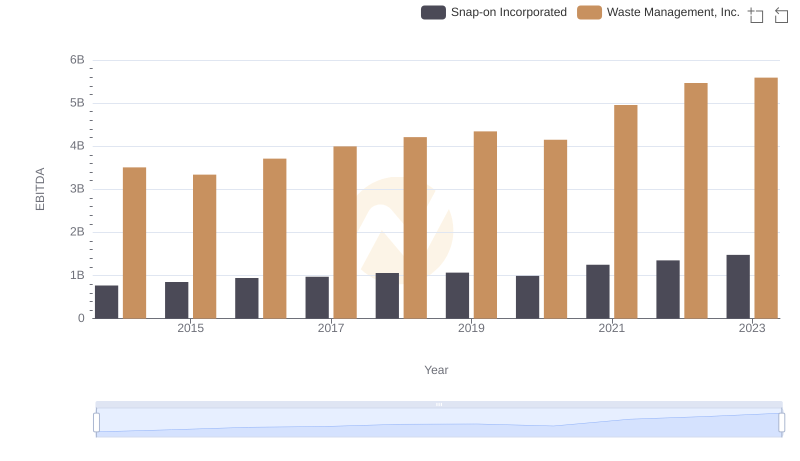
Professional EBITDA Benchmarking: Waste Management, Inc. vs Snap-on Incorporated