| __timestamp | Snap-on Incorporated | Waste Management, Inc. |
|---|---|---|
| Wednesday, January 1, 2014 | 1584300000 | 4994000000 |
| Thursday, January 1, 2015 | 1648300000 | 4730000000 |
| Friday, January 1, 2016 | 1709600000 | 5123000000 |
| Sunday, January 1, 2017 | 1824900000 | 5464000000 |
| Monday, January 1, 2018 | 1870000000 | 5665000000 |
| Tuesday, January 1, 2019 | 1844000000 | 5959000000 |
| Wednesday, January 1, 2020 | 1748500000 | 5877000000 |
| Friday, January 1, 2021 | 2110800000 | 6820000000 |
| Saturday, January 1, 2022 | 2181100000 | 7404000000 |
| Sunday, January 1, 2023 | 2619800000 | 7820000000 |
| Monday, January 1, 2024 | 2377900000 | 8680000000 |
Unleashing the power of data
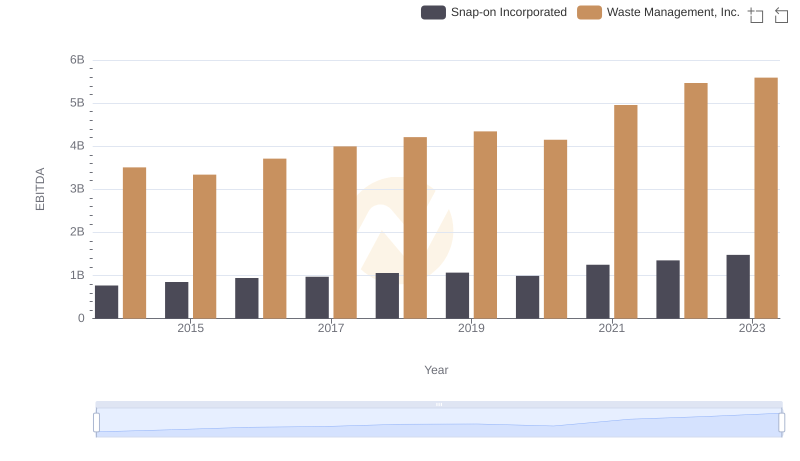
In the ever-evolving landscape of American industry, Waste Management, Inc. and Snap-on Incorporated stand as titans in their respective fields. Over the past decade, from 2014 to 2023, these companies have demonstrated remarkable growth in gross profit, reflecting their resilience and strategic prowess.
Waste Management, Inc., a leader in environmental services, has seen its gross profit soar by approximately 57%, from $5 billion in 2014 to nearly $7.8 billion in 2023. This growth underscores the increasing importance of sustainable waste solutions in today's eco-conscious world.
Meanwhile, Snap-on Incorporated, a key player in the manufacturing of high-quality tools, has experienced a 65% increase in gross profit, rising from $1.6 billion to $2.6 billion over the same period. This growth highlights the enduring demand for precision tools in various industries.
These trends not only reflect the companies' individual successes but also offer insights into broader economic shifts and consumer priorities.
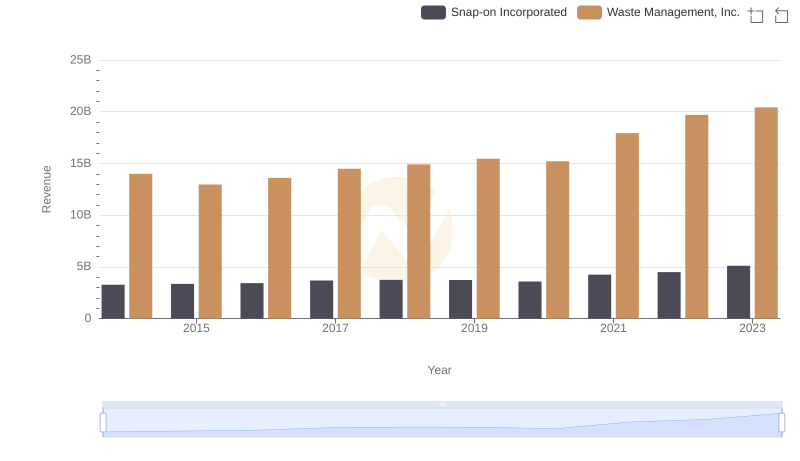
Waste Management, Inc. and Snap-on Incorporated: A Comprehensive Revenue Analysis
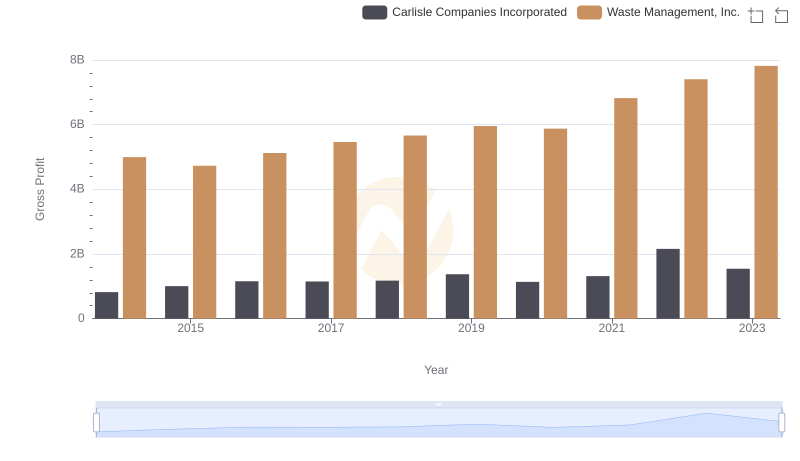
Gross Profit Analysis: Comparing Waste Management, Inc. and Carlisle Companies Incorporated
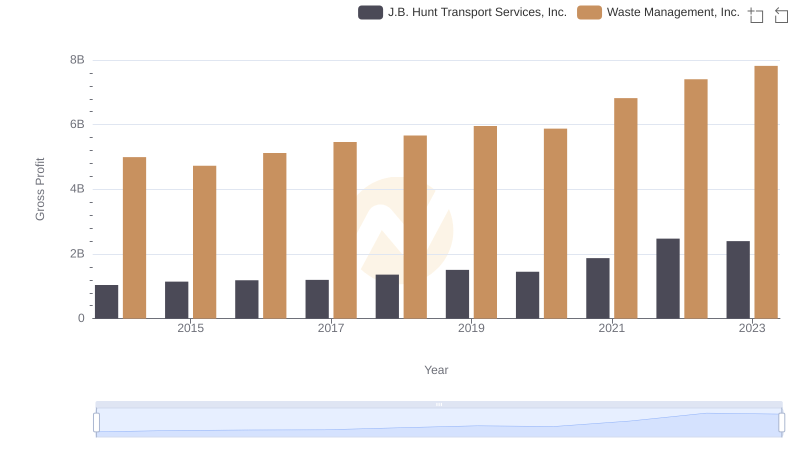
Gross Profit Analysis: Comparing Waste Management, Inc. and J.B. Hunt Transport Services, Inc.
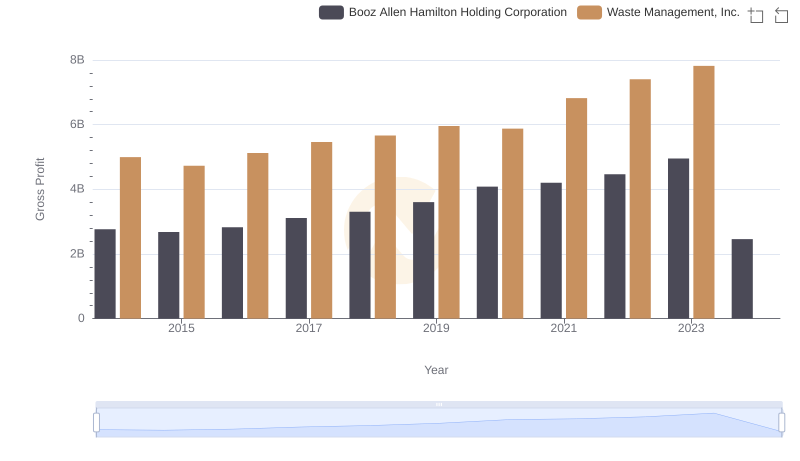
Key Insights on Gross Profit: Waste Management, Inc. vs Booz Allen Hamilton Holding Corporation
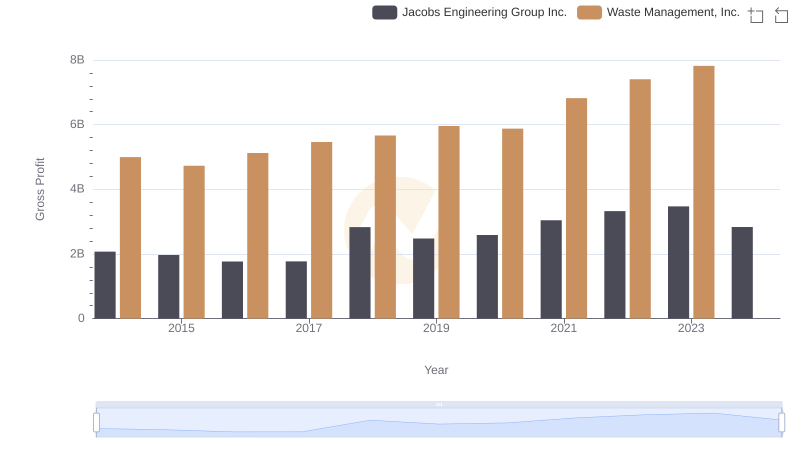
Waste Management, Inc. and Jacobs Engineering Group Inc.: A Detailed Gross Profit Analysis
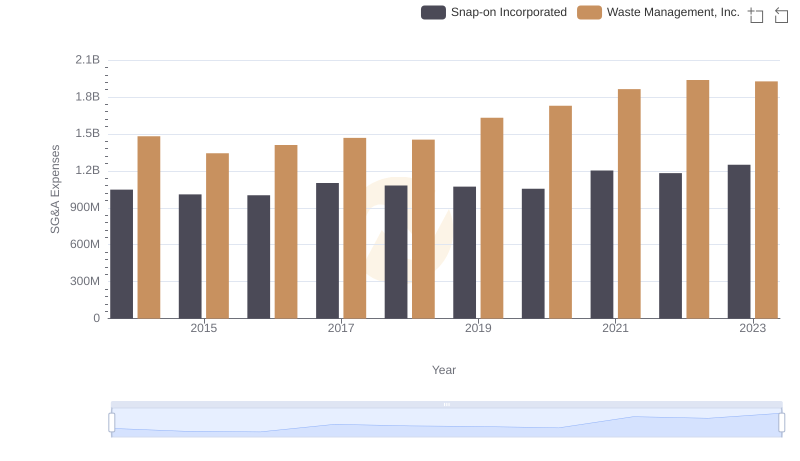
Operational Costs Compared: SG&A Analysis of Waste Management, Inc. and Snap-on Incorporated
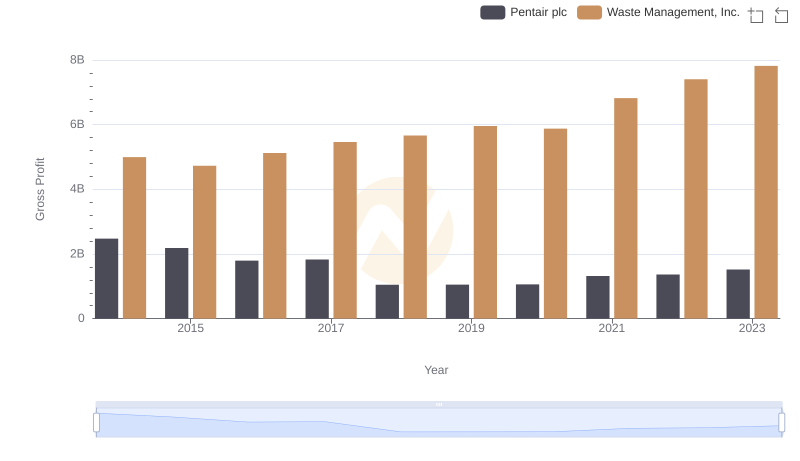
Who Generates Higher Gross Profit? Waste Management, Inc. or Pentair plc
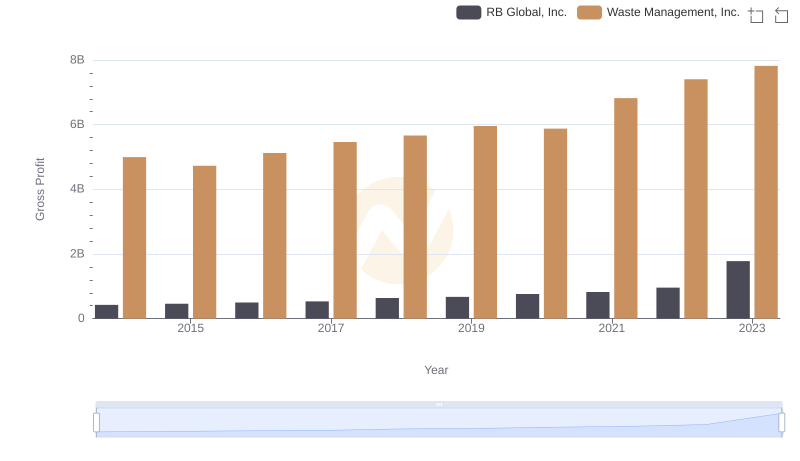
Gross Profit Comparison: Waste Management, Inc. and RB Global, Inc. Trends
Professional EBITDA Benchmarking: Waste Management, Inc. vs Snap-on Incorporated