| __timestamp | Global Payments Inc. | Lennox International Inc. |
|---|---|---|
| Wednesday, January 1, 2014 | 1295014000 | 573700000 |
| Thursday, January 1, 2015 | 1325567000 | 580500000 |
| Friday, January 1, 2016 | 1411096000 | 621000000 |
| Sunday, January 1, 2017 | 1488258000 | 637700000 |
| Monday, January 1, 2018 | 1534297000 | 608200000 |
| Tuesday, January 1, 2019 | 2046672000 | 585900000 |
| Wednesday, January 1, 2020 | 2878878000 | 555900000 |
| Friday, January 1, 2021 | 3391161000 | 598900000 |
| Saturday, January 1, 2022 | 3524578000 | 627200000 |
| Sunday, January 1, 2023 | 4073768000 | 705500000 |
| Monday, January 1, 2024 | 4285307000 | 730600000 |
Unveiling the hidden dimensions of data
In the ever-evolving landscape of corporate finance, Selling, General, and Administrative (SG&A) expenses serve as a crucial indicator of a company's operational efficiency. Over the past decade, Global Payments Inc. and Lennox International Inc. have showcased contrasting trajectories in their SG&A expenditures.
From 2014 to 2023, Global Payments Inc. experienced a staggering 214% increase in SG&A expenses, peaking in 2023. This upward trend reflects the company's aggressive expansion and investment in operational capabilities.
Conversely, Lennox International Inc. maintained a more stable SG&A profile, with a modest 23% increase over the same period. This stability underscores Lennox's focus on cost control and operational efficiency.
The data for 2024 is incomplete, highlighting the dynamic nature of financial reporting. As these companies continue to navigate the complexities of their respective industries, their SG&A strategies will remain pivotal to their financial health.

Revenue Showdown: Global Payments Inc. vs Lennox International Inc.

Cost of Revenue Trends: Global Payments Inc. vs Lennox International Inc.
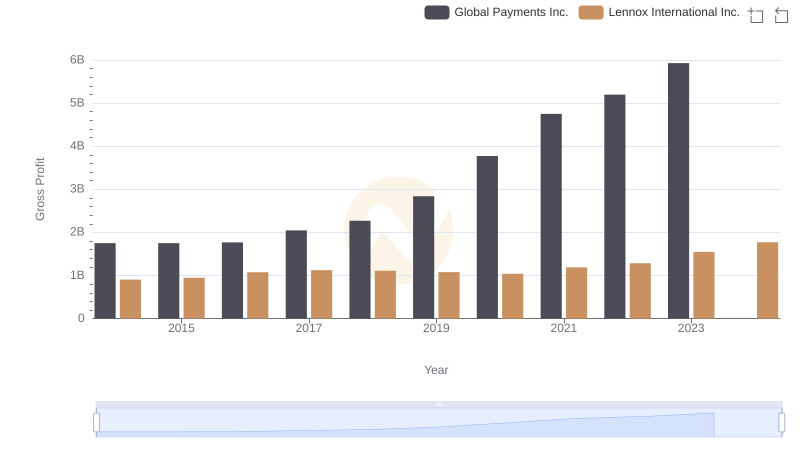
Key Insights on Gross Profit: Global Payments Inc. vs Lennox International Inc.
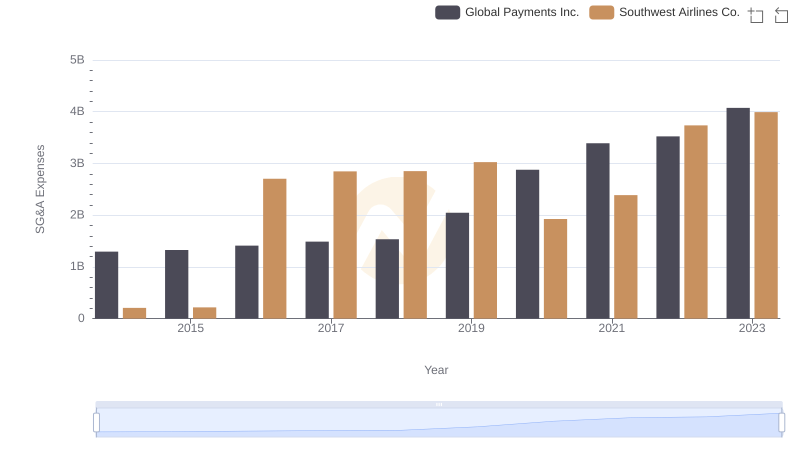
Comparing SG&A Expenses: Global Payments Inc. vs Southwest Airlines Co. Trends and Insights
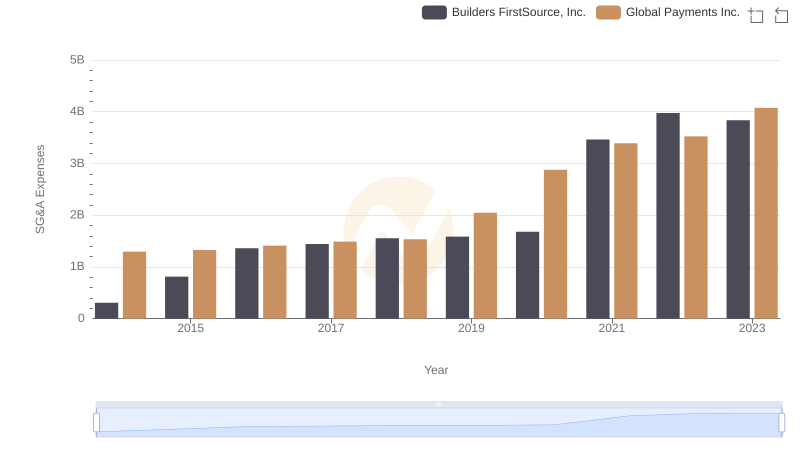
Cost Management Insights: SG&A Expenses for Global Payments Inc. and Builders FirstSource, Inc.
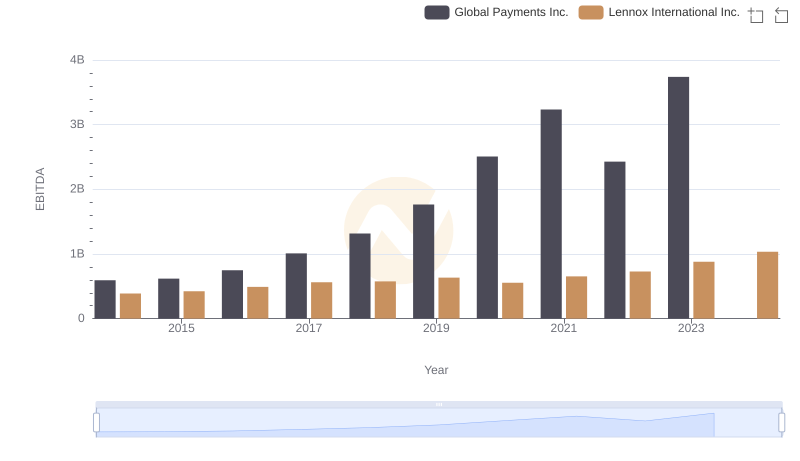
Professional EBITDA Benchmarking: Global Payments Inc. vs Lennox International Inc.
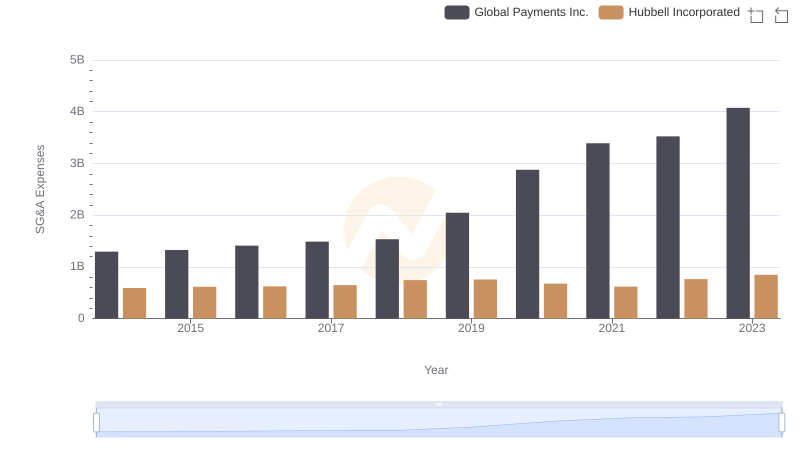
Comparing SG&A Expenses: Global Payments Inc. vs Hubbell Incorporated Trends and Insights
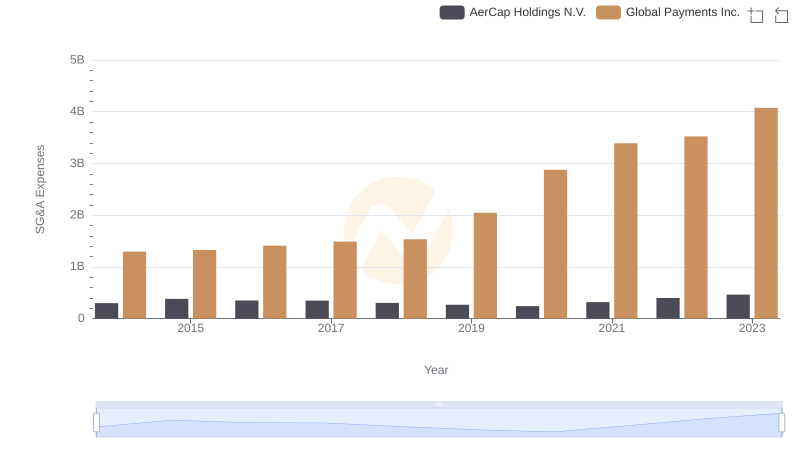
Cost Management Insights: SG&A Expenses for Global Payments Inc. and AerCap Holdings N.V.
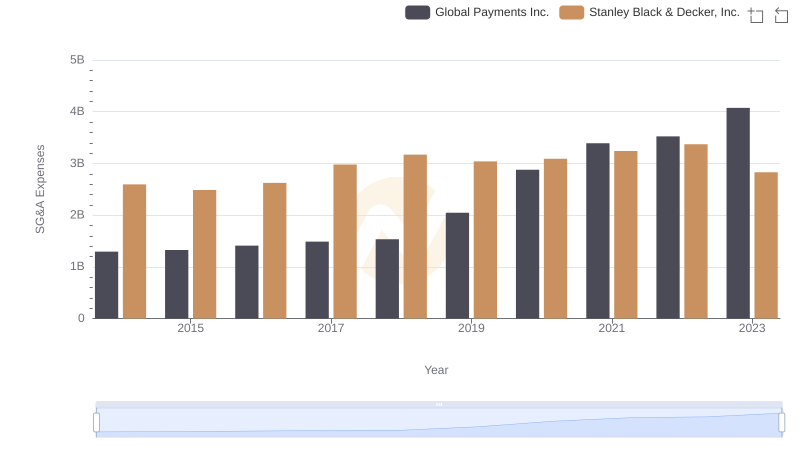
Breaking Down SG&A Expenses: Global Payments Inc. vs Stanley Black & Decker, Inc.
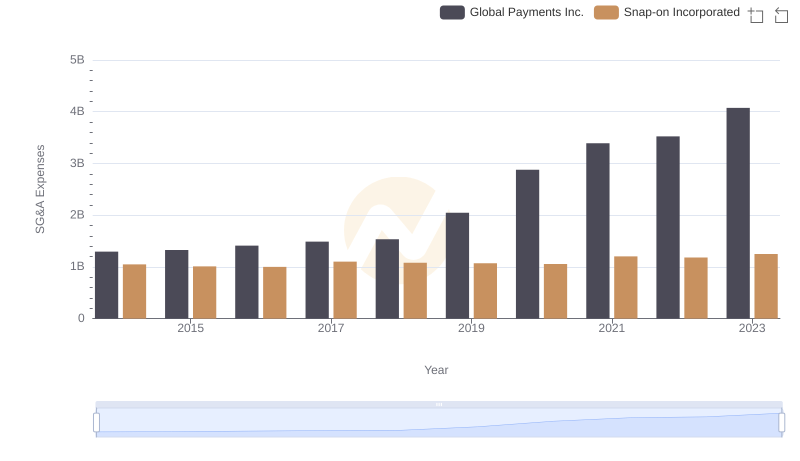
Operational Costs Compared: SG&A Analysis of Global Payments Inc. and Snap-on Incorporated
Global Payments Inc. vs Watsco, Inc.: SG&A Expense Trends