| __timestamp | Global Payments Inc. | Lennox International Inc. |
|---|---|---|
| Wednesday, January 1, 2014 | 1022107000 | 2464100000 |
| Thursday, January 1, 2015 | 1147639000 | 2520000000 |
| Friday, January 1, 2016 | 1603532000 | 2565100000 |
| Sunday, January 1, 2017 | 1928037000 | 2714400000 |
| Monday, January 1, 2018 | 1095014000 | 2772700000 |
| Tuesday, January 1, 2019 | 2073803000 | 2727400000 |
| Wednesday, January 1, 2020 | 3650727000 | 2594000000 |
| Friday, January 1, 2021 | 3773725000 | 3005700000 |
| Saturday, January 1, 2022 | 3778617000 | 3433700000 |
| Sunday, January 1, 2023 | 3727521000 | 3434100000 |
| Monday, January 1, 2024 | 3760116000 | 3569400000 |
Unlocking the unknown
In the ever-evolving landscape of corporate finance, understanding cost structures is crucial. This analysis delves into the cost of revenue trends for Global Payments Inc. and Lennox International Inc. from 2014 to 2023. Over this decade, Global Payments Inc. saw a remarkable increase of approximately 265% in its cost of revenue, peaking in 2022. This surge reflects the company's aggressive expansion and adaptation to the digital payment revolution. In contrast, Lennox International Inc. experienced a steadier growth of around 40%, indicative of its stable operations in the HVAC industry. Notably, 2023 data reveals a plateau for both companies, suggesting potential market saturation or strategic shifts. Missing data for Global Payments in 2024 hints at future uncertainties. This comparative insight underscores the dynamic nature of cost management in diverse industries.

Revenue Showdown: Global Payments Inc. vs Lennox International Inc.
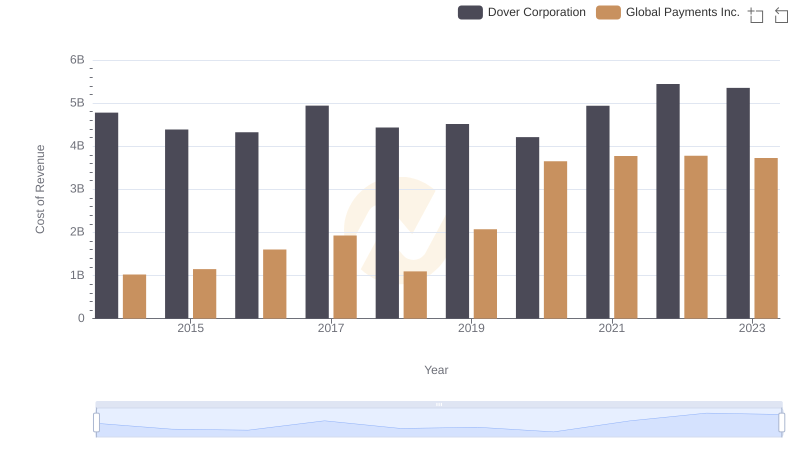
Comparing Cost of Revenue Efficiency: Global Payments Inc. vs Dover Corporation
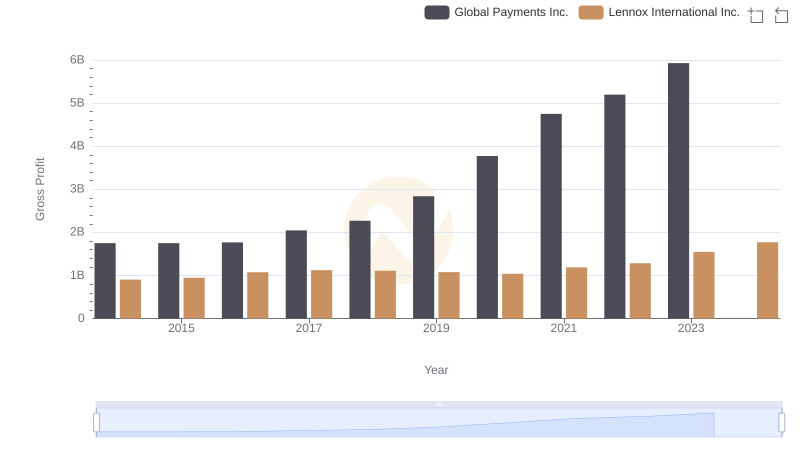
Key Insights on Gross Profit: Global Payments Inc. vs Lennox International Inc.
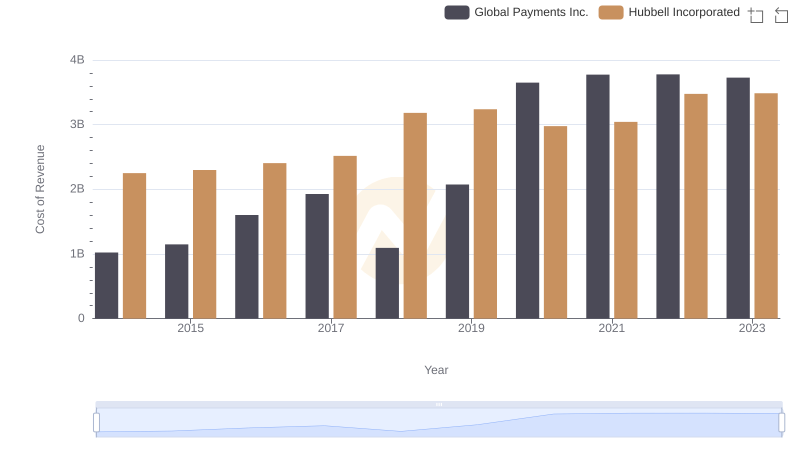
Cost Insights: Breaking Down Global Payments Inc. and Hubbell Incorporated's Expenses
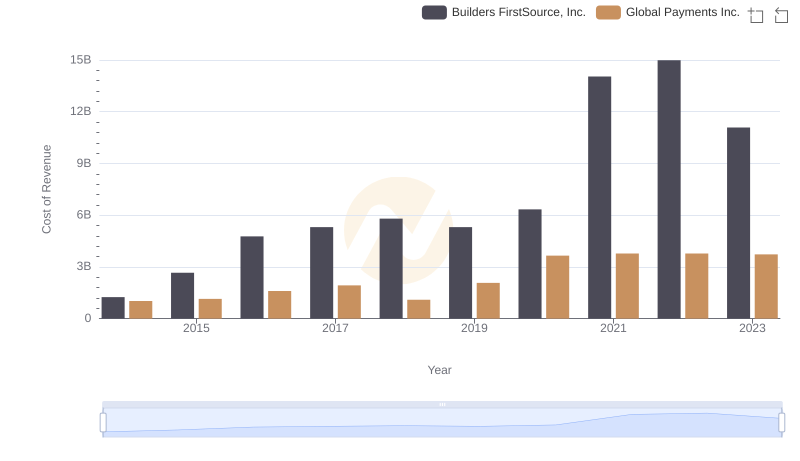
Global Payments Inc. vs Builders FirstSource, Inc.: Efficiency in Cost of Revenue Explored
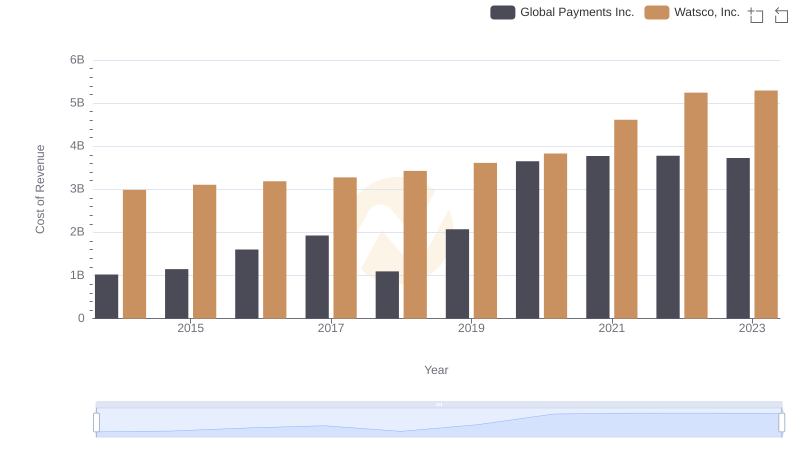
Global Payments Inc. vs Watsco, Inc.: Efficiency in Cost of Revenue Explored

Global Payments Inc. vs EMCOR Group, Inc.: Efficiency in Cost of Revenue Explored
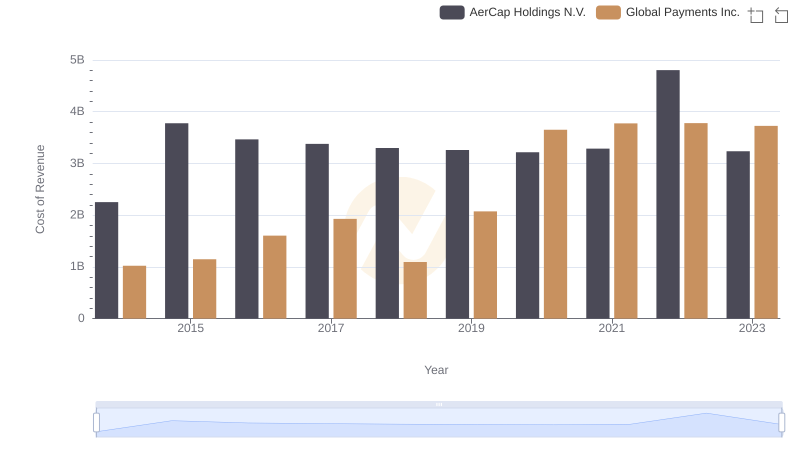
Cost of Revenue: Key Insights for Global Payments Inc. and AerCap Holdings N.V.
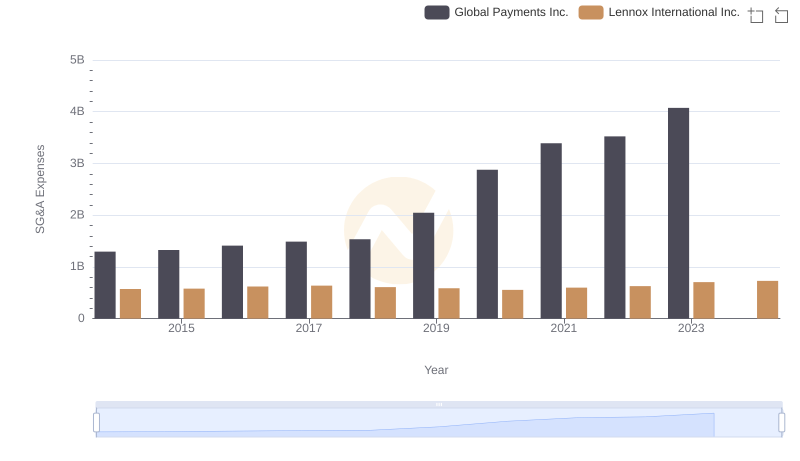
Selling, General, and Administrative Costs: Global Payments Inc. vs Lennox International Inc.
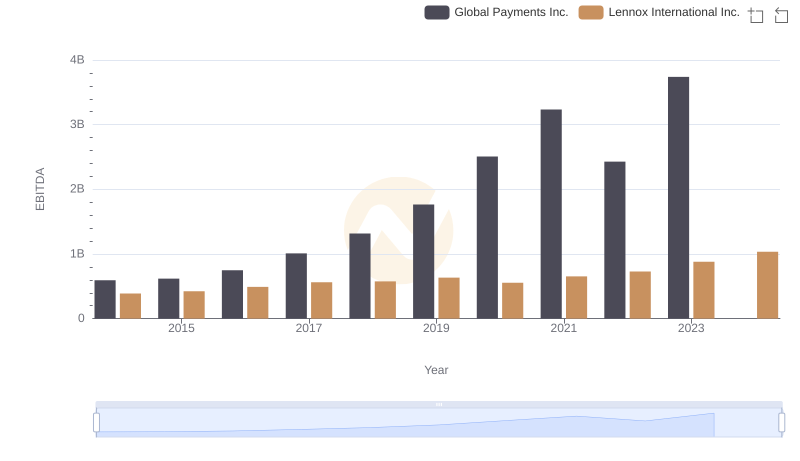
Professional EBITDA Benchmarking: Global Payments Inc. vs Lennox International Inc.