| __timestamp | Global Payments Inc. | Lennox International Inc. |
|---|---|---|
| Wednesday, January 1, 2014 | 2773718000 | 3367400000 |
| Thursday, January 1, 2015 | 2898150000 | 3467400000 |
| Friday, January 1, 2016 | 3370976000 | 3641600000 |
| Sunday, January 1, 2017 | 3975163000 | 3839600000 |
| Monday, January 1, 2018 | 3366366000 | 3883900000 |
| Tuesday, January 1, 2019 | 4911892000 | 3807200000 |
| Wednesday, January 1, 2020 | 7423558000 | 3634100000 |
| Friday, January 1, 2021 | 8523762000 | 4194100000 |
| Saturday, January 1, 2022 | 8975515000 | 4718400000 |
| Sunday, January 1, 2023 | 9654419000 | 4981900000 |
| Monday, January 1, 2024 | 10105894000 | 5341300000 |
Unlocking the unknown
In the ever-evolving landscape of global commerce, Global Payments Inc. and Lennox International Inc. have emerged as formidable players. Over the past decade, Global Payments Inc. has seen its revenue soar by an impressive 248%, from approximately $2.8 billion in 2014 to nearly $9.7 billion in 2023. This growth trajectory underscores the company's strategic prowess in the financial services sector.
Conversely, Lennox International Inc., a leader in climate control solutions, has experienced a steady revenue increase of about 49% over the same period, reaching close to $5 billion in 2023. Despite the absence of data for 2024, Lennox's consistent growth highlights its resilience and adaptability in a competitive market.
As these two giants continue to expand their global footprints, their revenue trends offer valuable insights into their strategic directions and market dynamics.
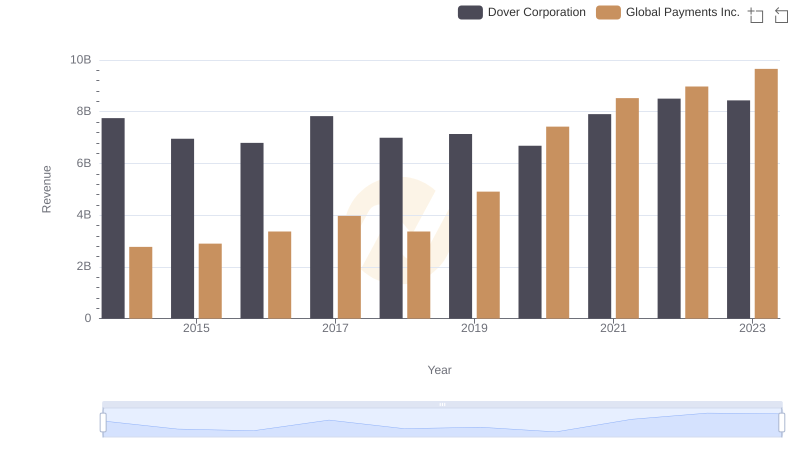
Breaking Down Revenue Trends: Global Payments Inc. vs Dover Corporation

Cost of Revenue Trends: Global Payments Inc. vs Lennox International Inc.
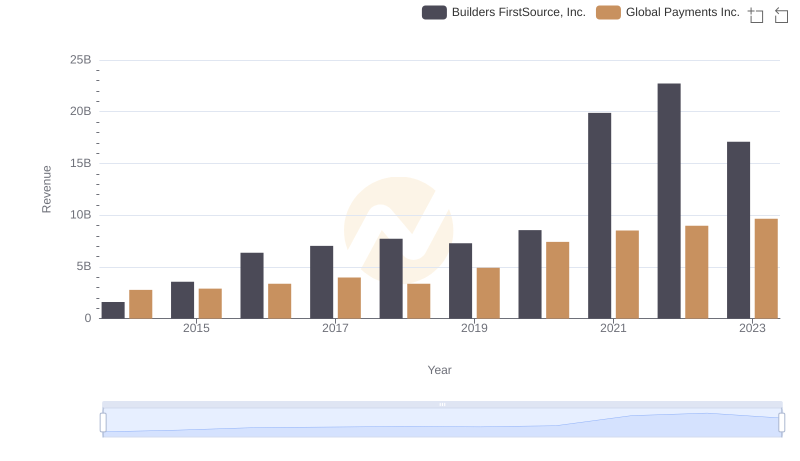
Global Payments Inc. or Builders FirstSource, Inc.: Who Leads in Yearly Revenue?
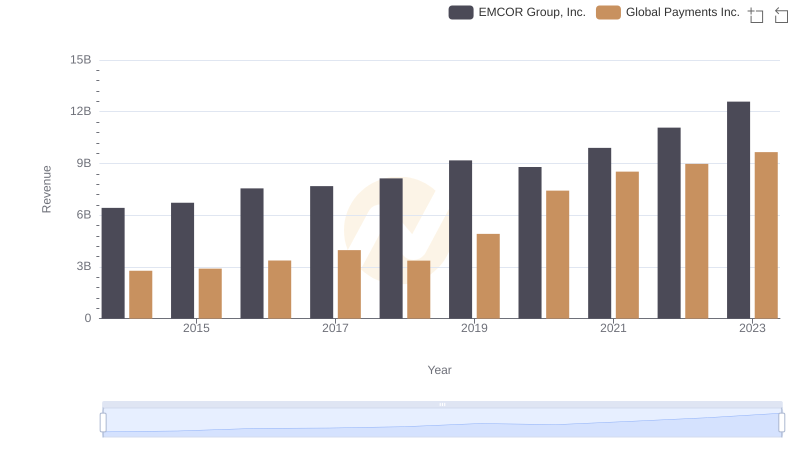
Comparing Revenue Performance: Global Payments Inc. or EMCOR Group, Inc.?
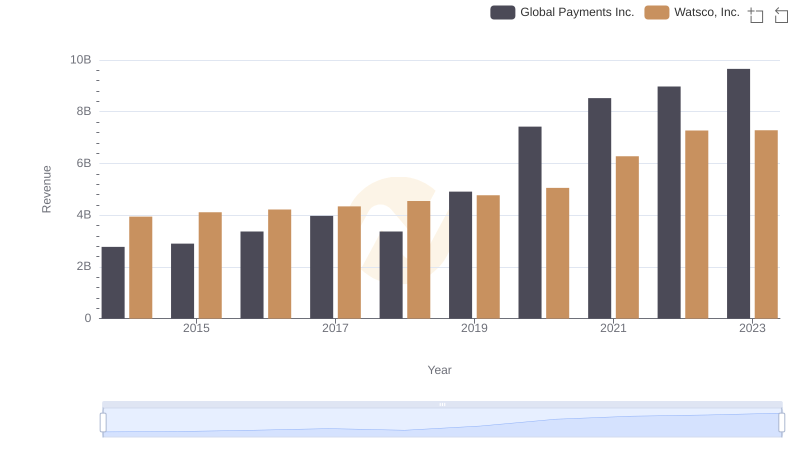
Revenue Showdown: Global Payments Inc. vs Watsco, Inc.
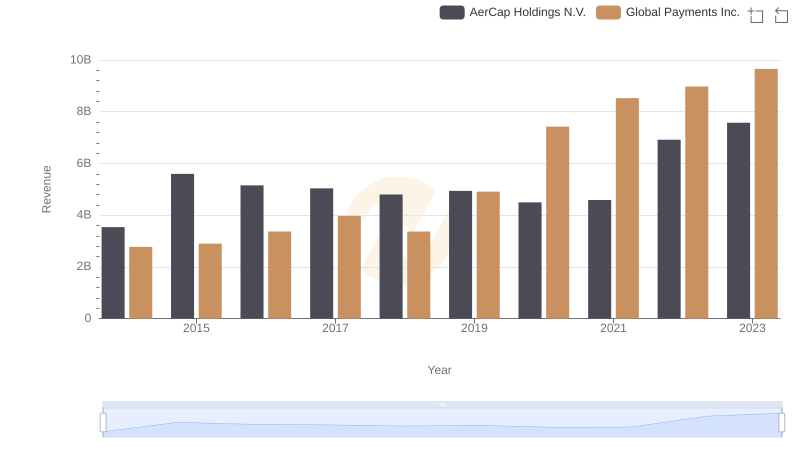
Global Payments Inc. vs AerCap Holdings N.V.: Examining Key Revenue Metrics
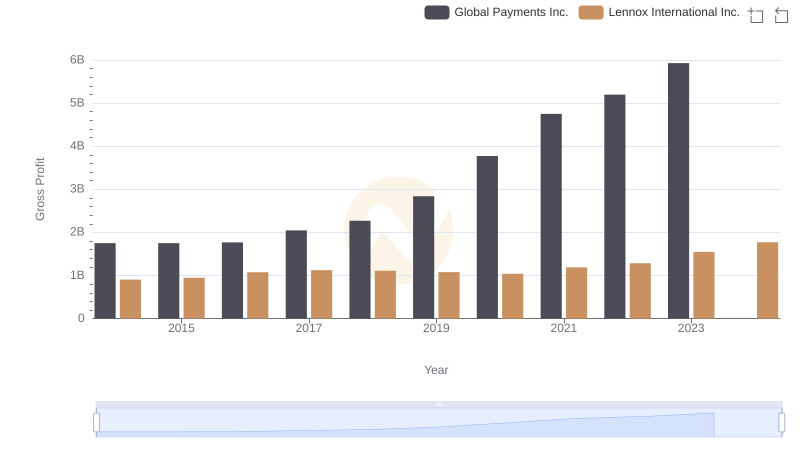
Key Insights on Gross Profit: Global Payments Inc. vs Lennox International Inc.
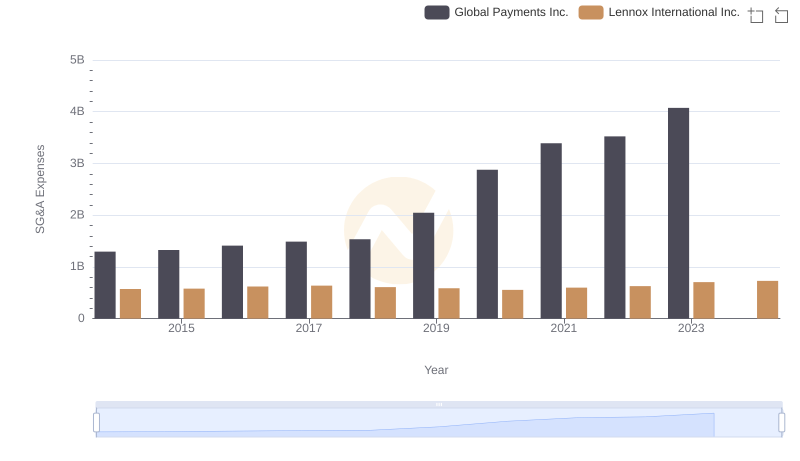
Selling, General, and Administrative Costs: Global Payments Inc. vs Lennox International Inc.
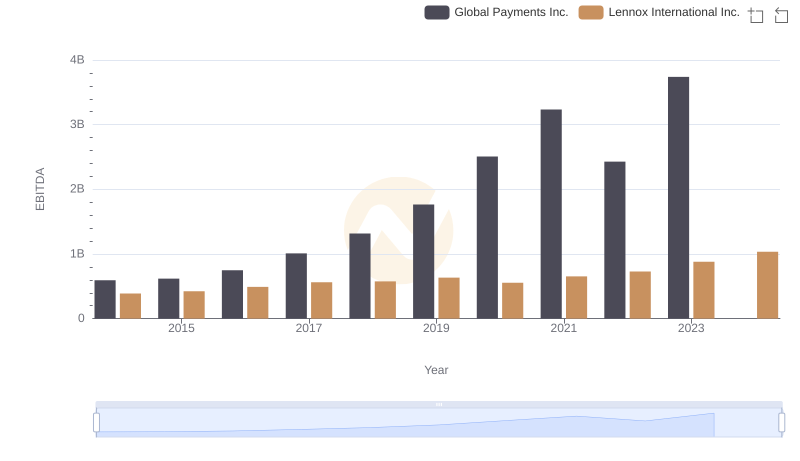
Professional EBITDA Benchmarking: Global Payments Inc. vs Lennox International Inc.