| __timestamp | Allegion plc | CSX Corporation |
|---|---|---|
| Wednesday, January 1, 2014 | 853700000 | 3613000000 |
| Thursday, January 1, 2015 | 869100000 | 3584000000 |
| Friday, January 1, 2016 | 985300000 | 3389000000 |
| Sunday, January 1, 2017 | 1070700000 | 3773000000 |
| Monday, January 1, 2018 | 1173300000 | 4773000000 |
| Tuesday, January 1, 2019 | 1252300000 | 4874000000 |
| Wednesday, January 1, 2020 | 1178800000 | 4362000000 |
| Friday, January 1, 2021 | 1204900000 | 5140000000 |
| Saturday, January 1, 2022 | 1322400000 | 5785000000 |
| Sunday, January 1, 2023 | 1581500000 | 5527000000 |
| Monday, January 1, 2024 | 1668500000 |
Data in motion
In the ever-evolving landscape of the stock market, understanding the financial health of companies is crucial. This analysis delves into the gross profit trends of two industry titans: CSX Corporation and Allegion plc, from 2014 to 2023.
CSX Corporation, a leader in the transportation sector, has shown a robust growth trajectory. From 2014 to 2023, its gross profit surged by approximately 53%, peaking in 2022. This growth underscores CSX's strategic prowess in navigating market challenges and capitalizing on opportunities.
Allegion plc, a key player in security solutions, has also demonstrated impressive growth. Over the same period, its gross profit increased by about 85%, with a notable spike in 2023. This trend highlights Allegion's innovative approach and expanding market presence.
Both companies have shown resilience and adaptability, reflecting broader industry trends and economic conditions.
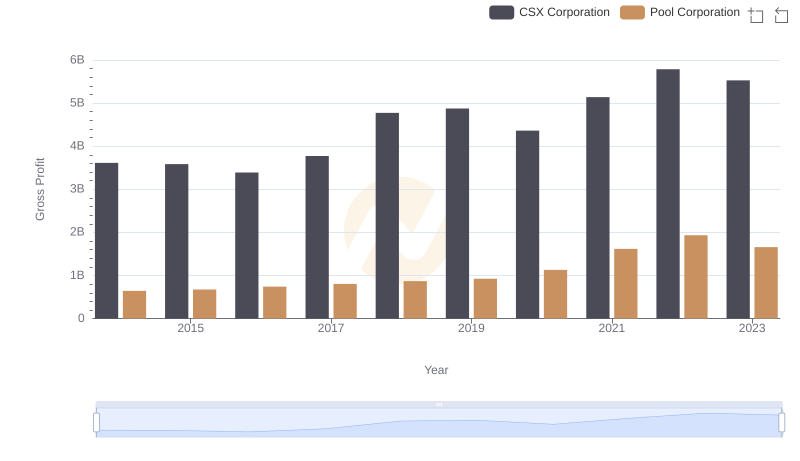
CSX Corporation vs Pool Corporation: A Gross Profit Performance Breakdown
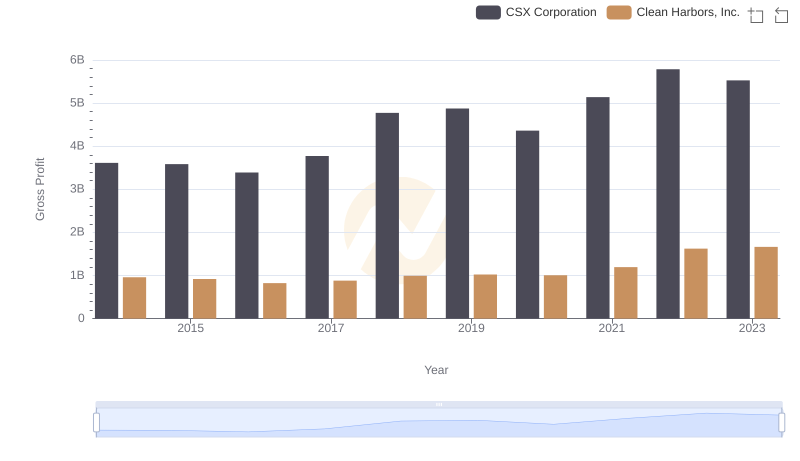
Gross Profit Analysis: Comparing CSX Corporation and Clean Harbors, Inc.
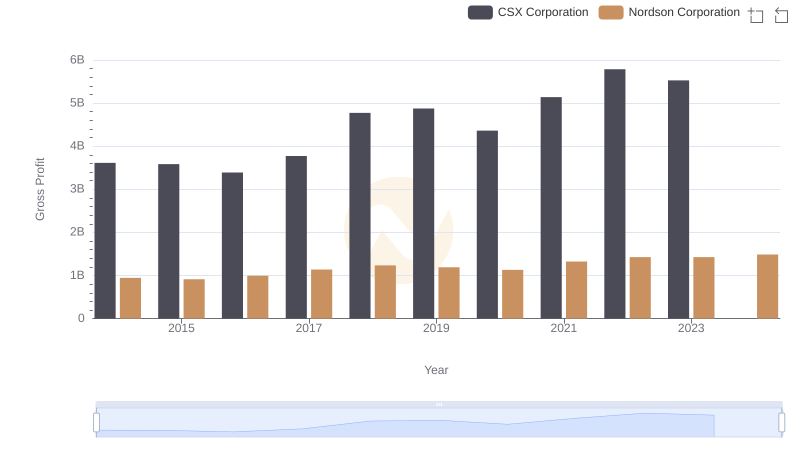
Gross Profit Trends Compared: CSX Corporation vs Nordson Corporation
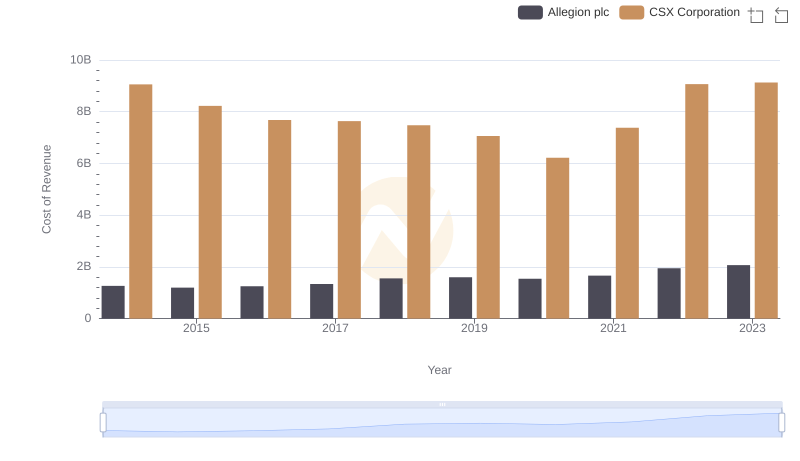
CSX Corporation vs Allegion plc: Efficiency in Cost of Revenue Explored
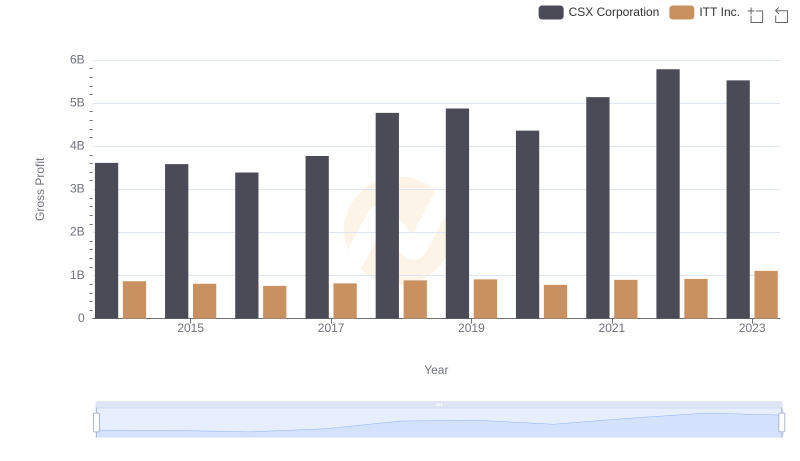
Gross Profit Comparison: CSX Corporation and ITT Inc. Trends
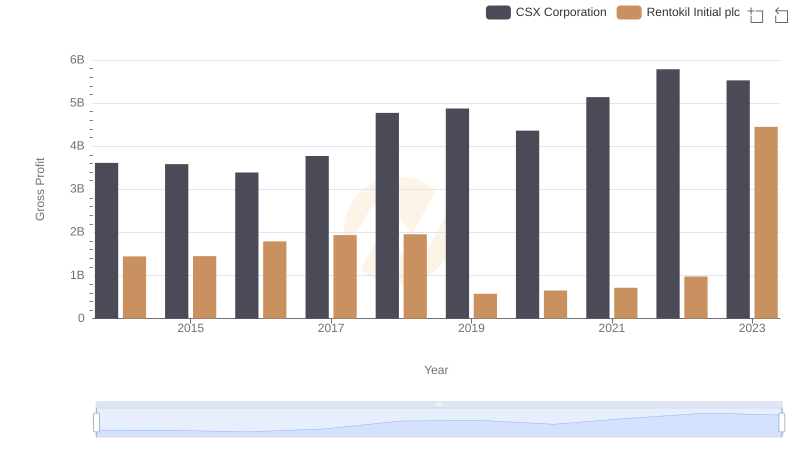
Gross Profit Comparison: CSX Corporation and Rentokil Initial plc Trends
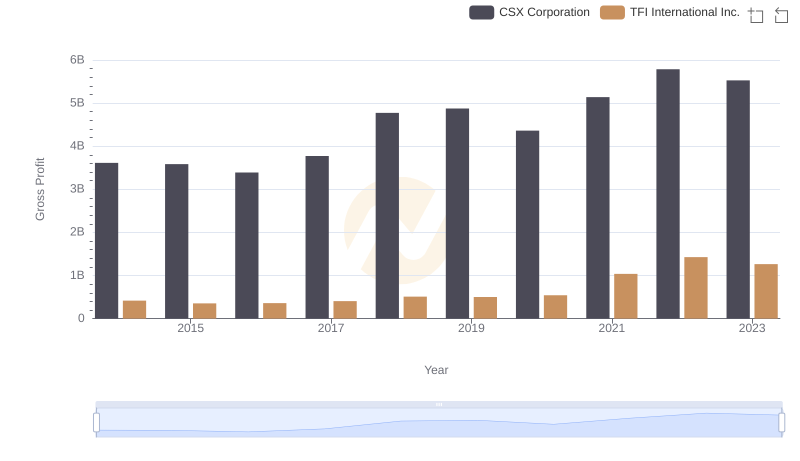
Key Insights on Gross Profit: CSX Corporation vs TFI International Inc.
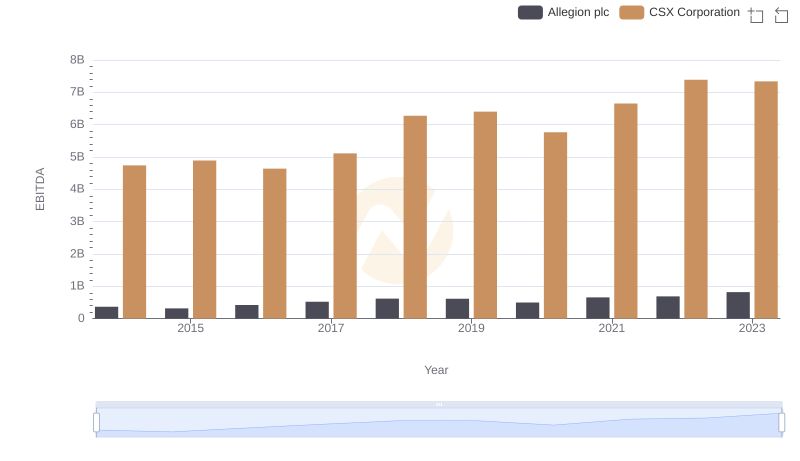
Professional EBITDA Benchmarking: CSX Corporation vs Allegion plc