| __timestamp | Cisco Systems, Inc. | The Trade Desk, Inc. |
|---|---|---|
| Wednesday, January 1, 2014 | 12709000000 | 580000 |
| Thursday, January 1, 2015 | 14209000000 | 32824000 |
| Friday, January 1, 2016 | 15678000000 | 61316000 |
| Sunday, January 1, 2017 | 15383000000 | 76565000 |
| Monday, January 1, 2018 | 16172000000 | 107323000 |
| Tuesday, January 1, 2019 | 17334000000 | 112196000 |
| Wednesday, January 1, 2020 | 16363000000 | 144208000 |
| Friday, January 1, 2021 | 15558000000 | 124817000 |
| Saturday, January 1, 2022 | 16794000000 | 168079000 |
| Sunday, January 1, 2023 | 17471000000 | 280898000 |
| Monday, January 1, 2024 | 15747000000 | 427167000 |
Unveiling the hidden dimensions of data
In the ever-evolving landscape of technology, Cisco Systems, Inc. and The Trade Desk, Inc. stand as titans in their respective domains. Over the past decade, Cisco has consistently demonstrated robust financial health, with its EBITDA growing by approximately 37% from 2014 to 2023. This growth underscores Cisco's strategic prowess in maintaining its market leadership.
Conversely, The Trade Desk, a rising star in digital advertising, has shown an impressive EBITDA growth trajectory, skyrocketing by over 480% from 2014 to 2023. This remarkable increase highlights The Trade Desk's innovative approach and its ability to capture market share in a competitive industry.
While Cisco's EBITDA remains significantly higher, The Trade Desk's rapid growth is a testament to its potential. The data for 2024 is incomplete, suggesting a need for cautious optimism as both companies navigate future challenges.
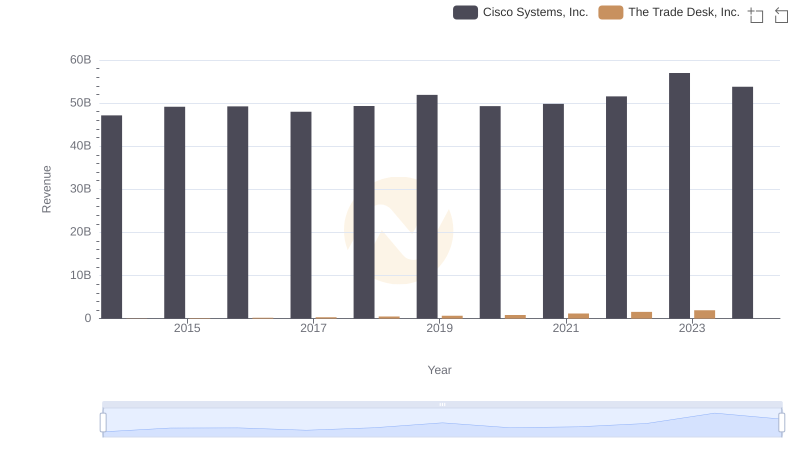
Cisco Systems, Inc. or The Trade Desk, Inc.: Who Leads in Yearly Revenue?
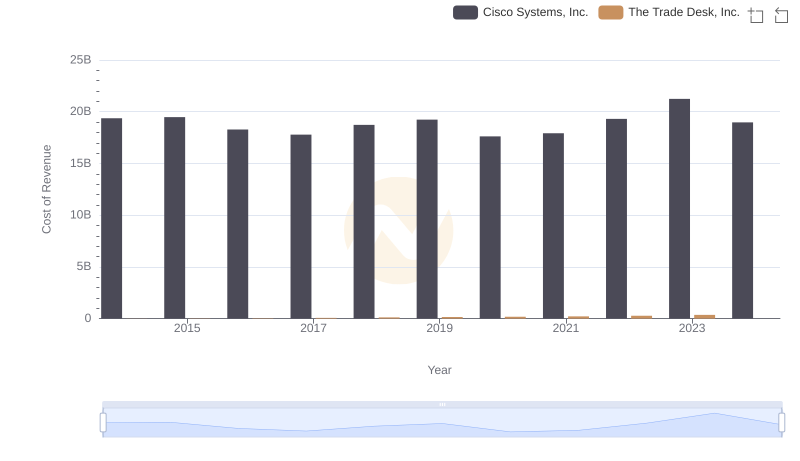
Cost of Revenue Trends: Cisco Systems, Inc. vs The Trade Desk, Inc.
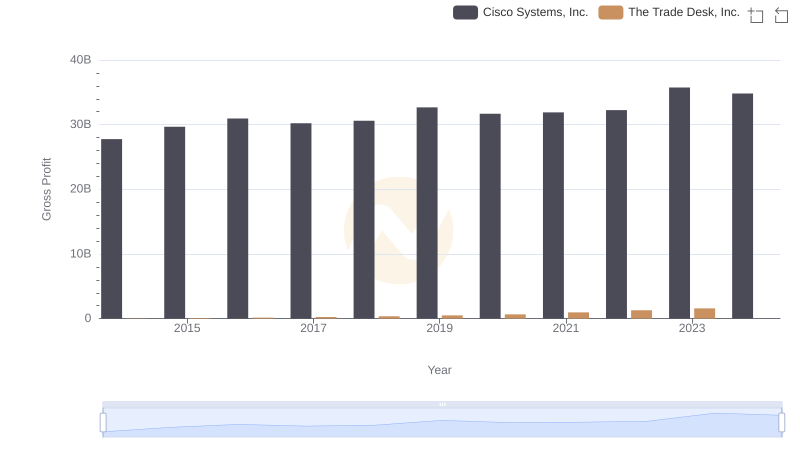
Gross Profit Analysis: Comparing Cisco Systems, Inc. and The Trade Desk, Inc.
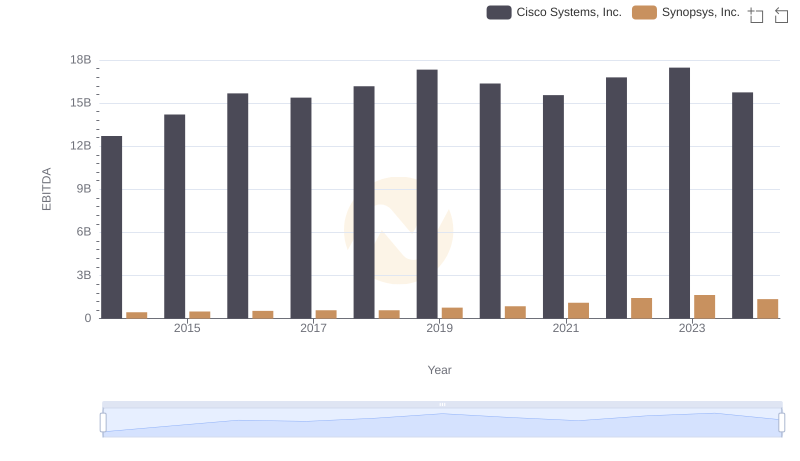
Comparative EBITDA Analysis: Cisco Systems, Inc. vs Synopsys, Inc.
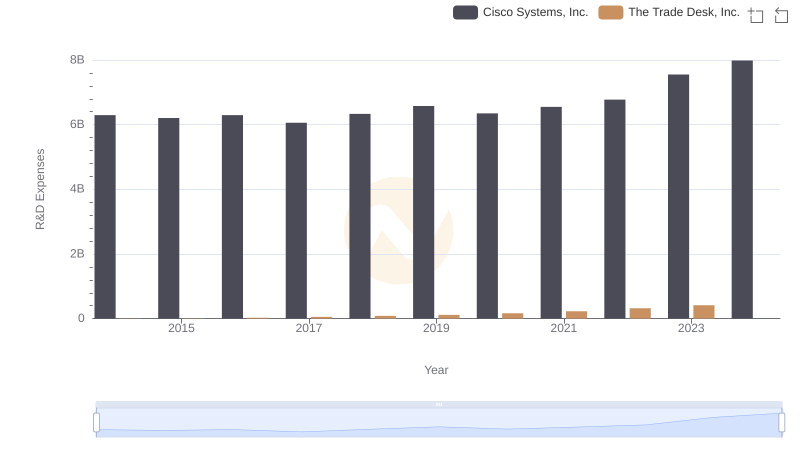
R&D Insights: How Cisco Systems, Inc. and The Trade Desk, Inc. Allocate Funds
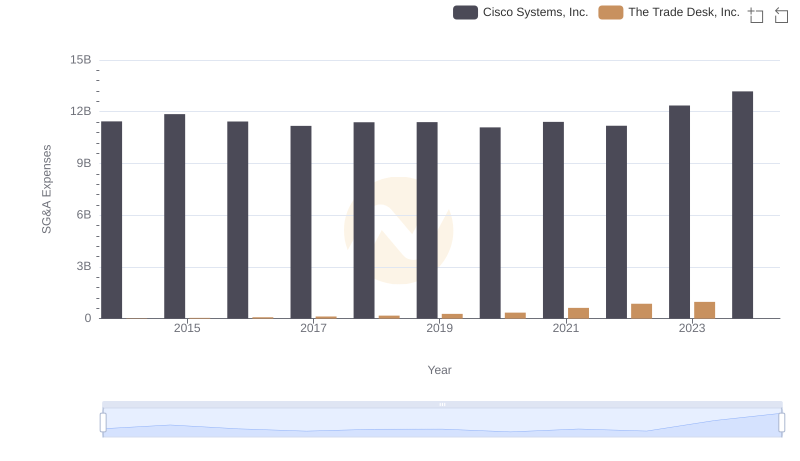
Cost Management Insights: SG&A Expenses for Cisco Systems, Inc. and The Trade Desk, Inc.
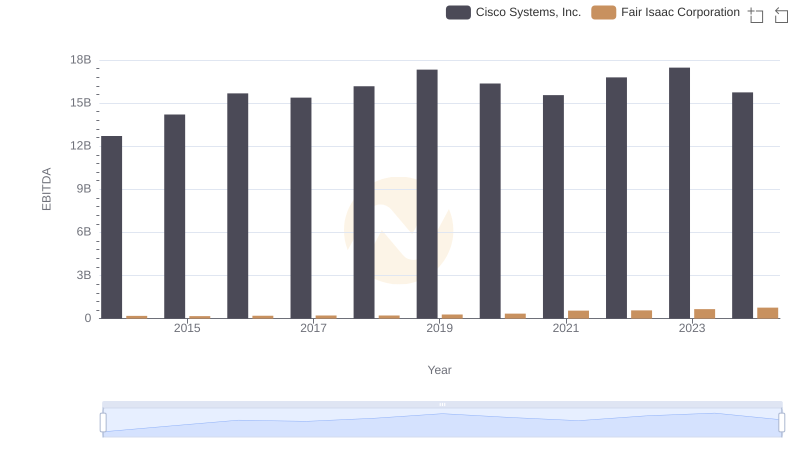
EBITDA Analysis: Evaluating Cisco Systems, Inc. Against Fair Isaac Corporation
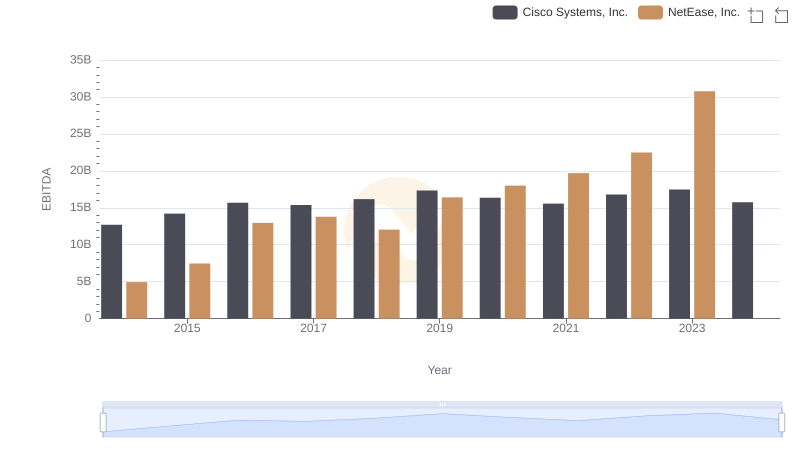
Comparative EBITDA Analysis: Cisco Systems, Inc. vs NetEase, Inc.
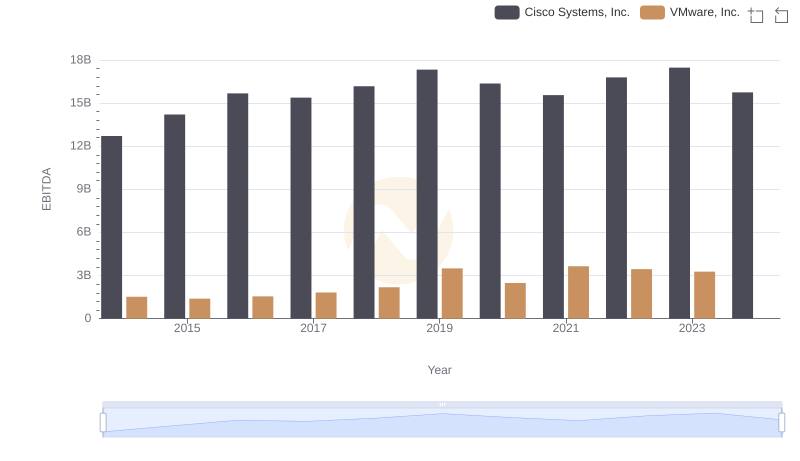
Cisco Systems, Inc. and VMware, Inc.: A Detailed Examination of EBITDA Performance
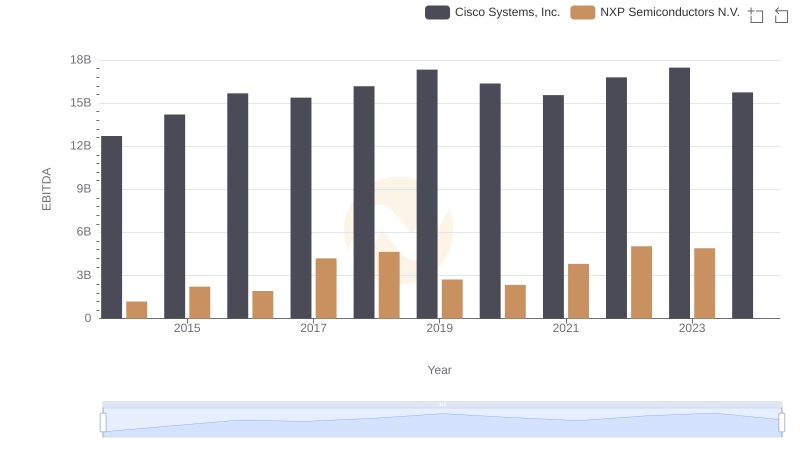
Comparative EBITDA Analysis: Cisco Systems, Inc. vs NXP Semiconductors N.V.
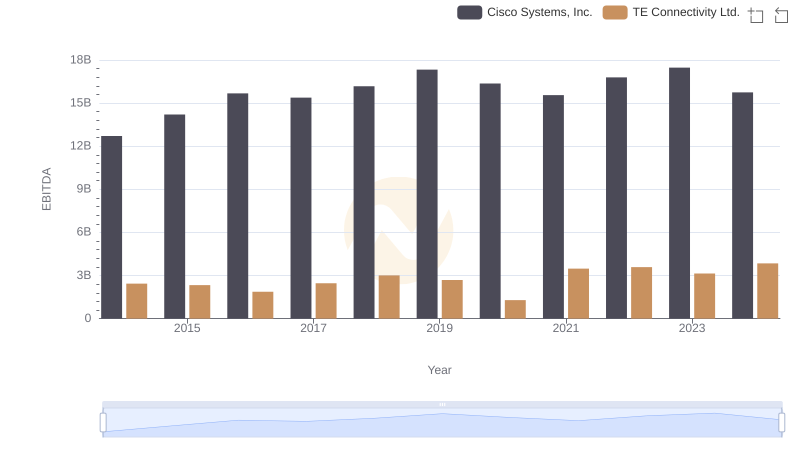
Professional EBITDA Benchmarking: Cisco Systems, Inc. vs TE Connectivity Ltd.
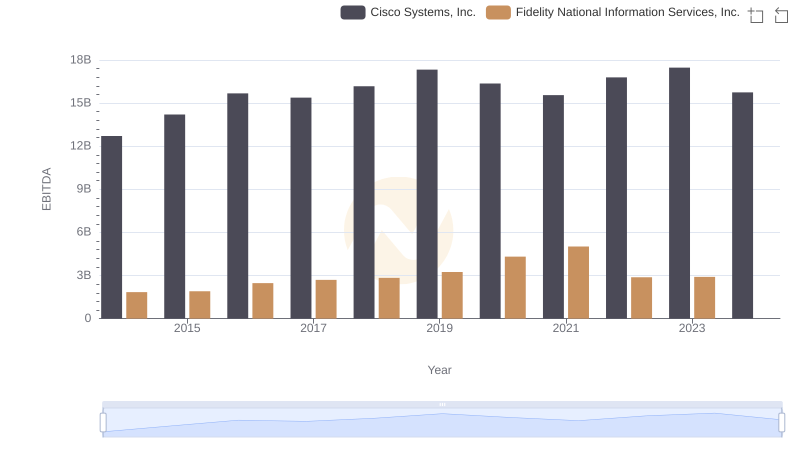
Comprehensive EBITDA Comparison: Cisco Systems, Inc. vs Fidelity National Information Services, Inc.