| __timestamp | Cisco Systems, Inc. | Synopsys, Inc. |
|---|---|---|
| Wednesday, January 1, 2014 | 12709000000 | 441543000 |
| Thursday, January 1, 2015 | 14209000000 | 496245000 |
| Friday, January 1, 2016 | 15678000000 | 540351000 |
| Sunday, January 1, 2017 | 15383000000 | 584909000 |
| Monday, January 1, 2018 | 16172000000 | 581213000 |
| Tuesday, January 1, 2019 | 17334000000 | 761347000 |
| Wednesday, January 1, 2020 | 16363000000 | 857403000 |
| Friday, January 1, 2021 | 15558000000 | 1101071000 |
| Saturday, January 1, 2022 | 16794000000 | 1435158000 |
| Sunday, January 1, 2023 | 17471000000 | 1647785000 |
| Monday, January 1, 2024 | 15747000000 | 1355711000 |
In pursuit of knowledge
In the ever-evolving tech industry, Cisco Systems, Inc. and Synopsys, Inc. have demonstrated remarkable financial resilience over the past decade. From 2014 to 2023, Cisco's EBITDA has shown a steady upward trajectory, peaking at approximately $17.5 billion in 2023, marking a 37% increase from 2014. This growth underscores Cisco's robust market position and strategic investments.
Conversely, Synopsys, Inc. has experienced a more dynamic growth pattern, with its EBITDA surging by nearly 273% over the same period, reaching around $1.65 billion in 2023. This impressive rise highlights Synopsys' expanding influence in the semiconductor design sector.
While Cisco's EBITDA remains significantly higher, Synopsys' rapid growth rate is noteworthy, reflecting its strategic advancements and market adaptability. As we look to the future, these trends offer valuable insights into the competitive landscape of the tech industry.

Cisco Systems, Inc. vs Synopsys, Inc.: Annual Revenue Growth Compared
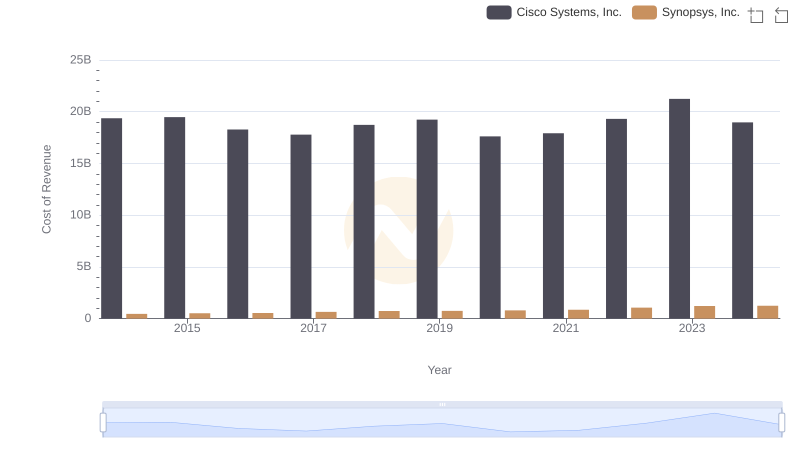
Cost of Revenue: Key Insights for Cisco Systems, Inc. and Synopsys, Inc.

Cisco Systems, Inc. vs Synopsys, Inc.: A Gross Profit Performance Breakdown
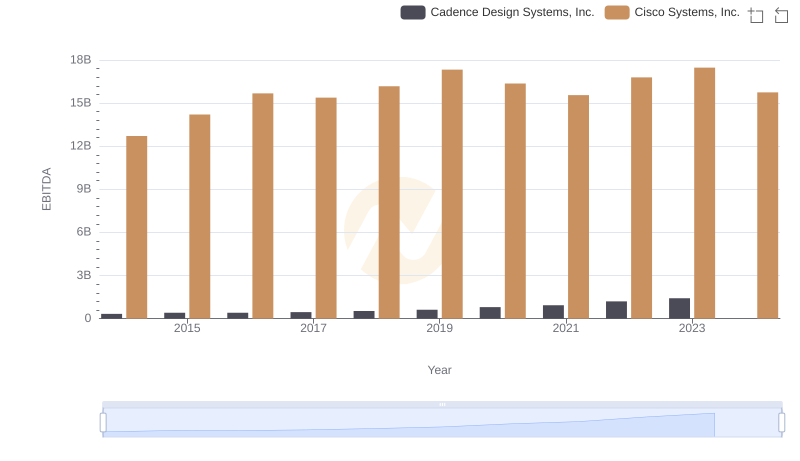
Professional EBITDA Benchmarking: Cisco Systems, Inc. vs Cadence Design Systems, Inc.

Research and Development Expenses Breakdown: Cisco Systems, Inc. vs Synopsys, Inc.
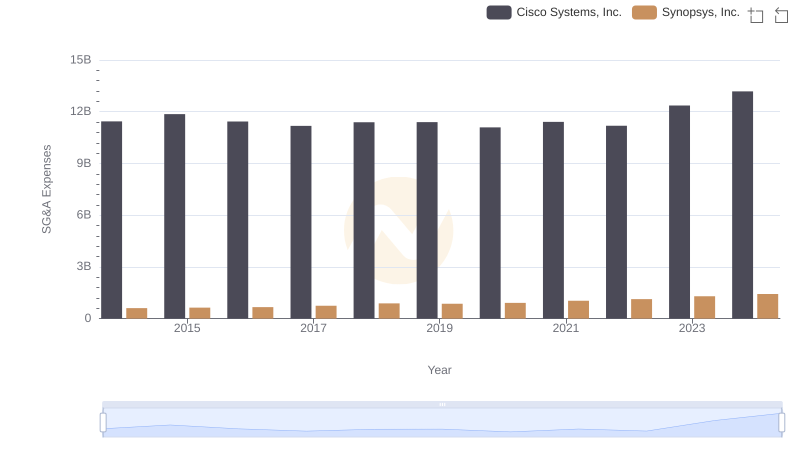
Who Optimizes SG&A Costs Better? Cisco Systems, Inc. or Synopsys, Inc.
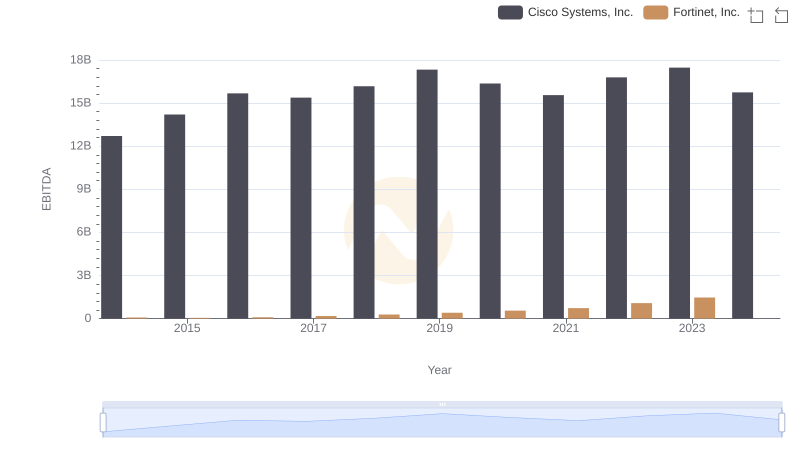
EBITDA Metrics Evaluated: Cisco Systems, Inc. vs Fortinet, Inc.
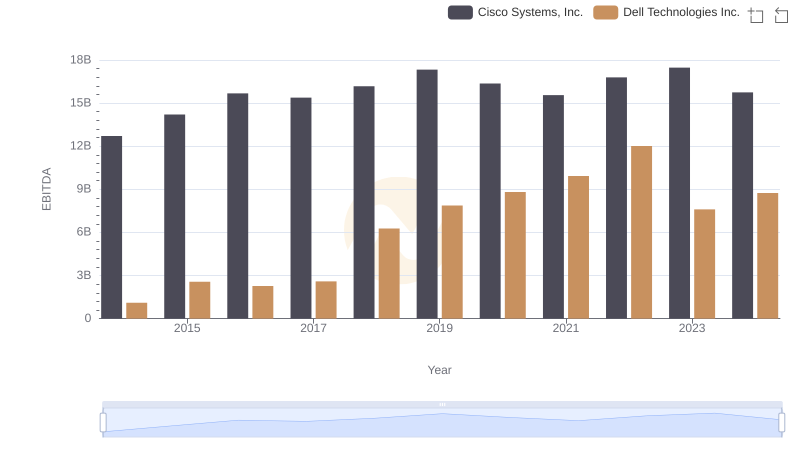
Professional EBITDA Benchmarking: Cisco Systems, Inc. vs Dell Technologies Inc.
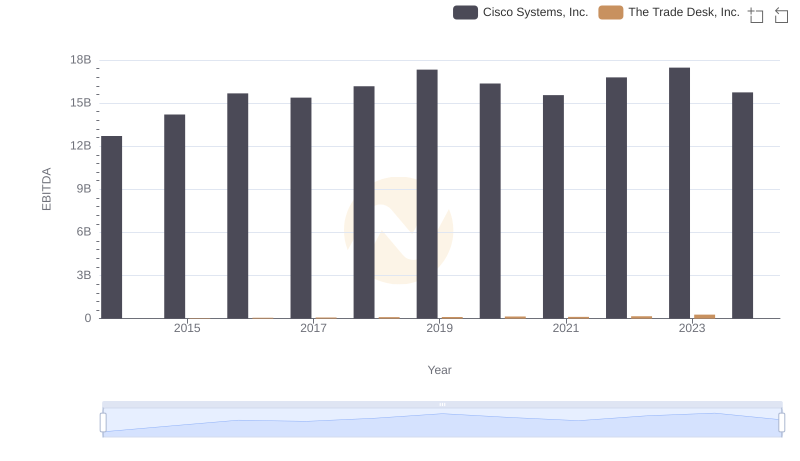
Professional EBITDA Benchmarking: Cisco Systems, Inc. vs The Trade Desk, Inc.
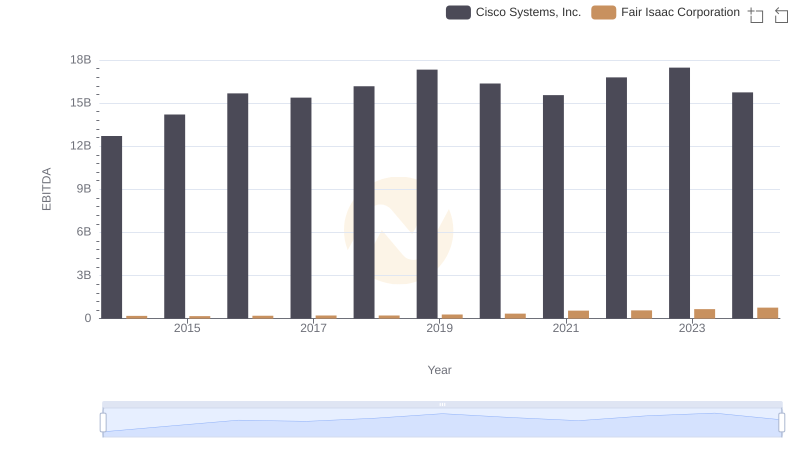
EBITDA Analysis: Evaluating Cisco Systems, Inc. Against Fair Isaac Corporation
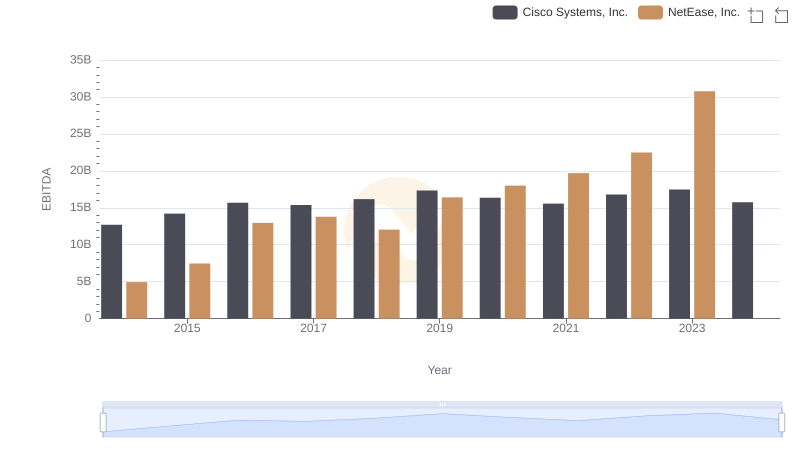
Comparative EBITDA Analysis: Cisco Systems, Inc. vs NetEase, Inc.
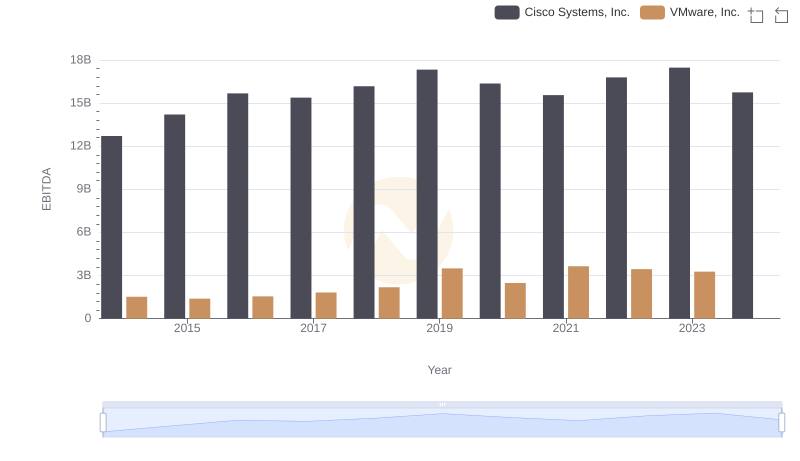
Cisco Systems, Inc. and VMware, Inc.: A Detailed Examination of EBITDA Performance