| __timestamp | Cisco Systems, Inc. | The Trade Desk, Inc. |
|---|---|---|
| Wednesday, January 1, 2014 | 19373000000 | 12559000 |
| Thursday, January 1, 2015 | 19480000000 | 22967000 |
| Friday, January 1, 2016 | 18287000000 | 39876000 |
| Sunday, January 1, 2017 | 17781000000 | 66230000 |
| Monday, January 1, 2018 | 18724000000 | 114098000 |
| Tuesday, January 1, 2019 | 19238000000 | 156180000 |
| Wednesday, January 1, 2020 | 17618000000 | 178812000 |
| Friday, January 1, 2021 | 17924000000 | 221554000 |
| Saturday, January 1, 2022 | 19309000000 | 281123000 |
| Sunday, January 1, 2023 | 21245000000 | 365598000 |
| Monday, January 1, 2024 | 18975000000 | 472012000 |
Data in motion
In the ever-evolving tech landscape, Cisco Systems, Inc. and The Trade Desk, Inc. have carved distinct paths. Cisco, a stalwart in networking, has seen its cost of revenue fluctuate modestly over the past decade, peaking in 2023 with a 10% increase from 2014. Meanwhile, The Trade Desk, a digital advertising powerhouse, has experienced a meteoric rise, with its cost of revenue surging by over 2800% from 2014 to 2023. This stark contrast highlights the dynamic nature of tech industries, where established giants and nimble newcomers navigate different growth trajectories. Notably, data for The Trade Desk in 2024 is missing, leaving room for speculation on its future course. As we delve into these trends, we gain insights into how these companies manage operational costs amidst rapid technological advancements.
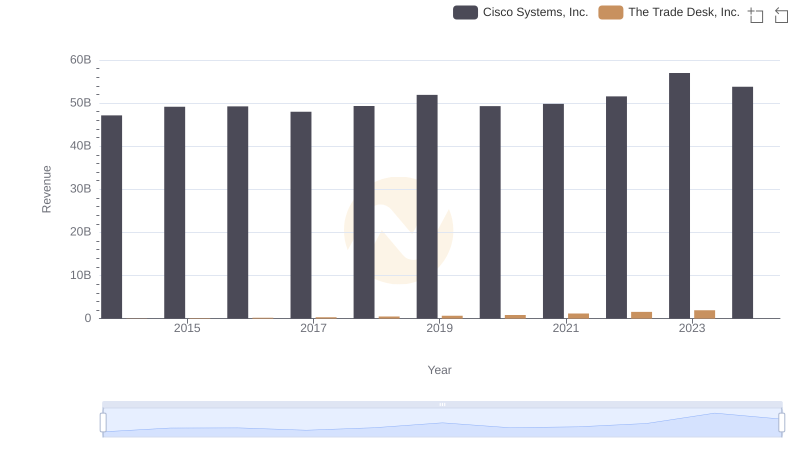
Cisco Systems, Inc. or The Trade Desk, Inc.: Who Leads in Yearly Revenue?
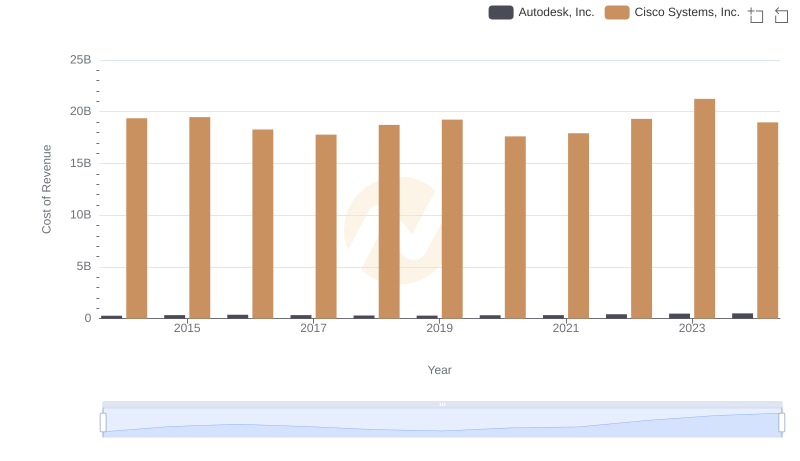
Cost Insights: Breaking Down Cisco Systems, Inc. and Autodesk, Inc.'s Expenses
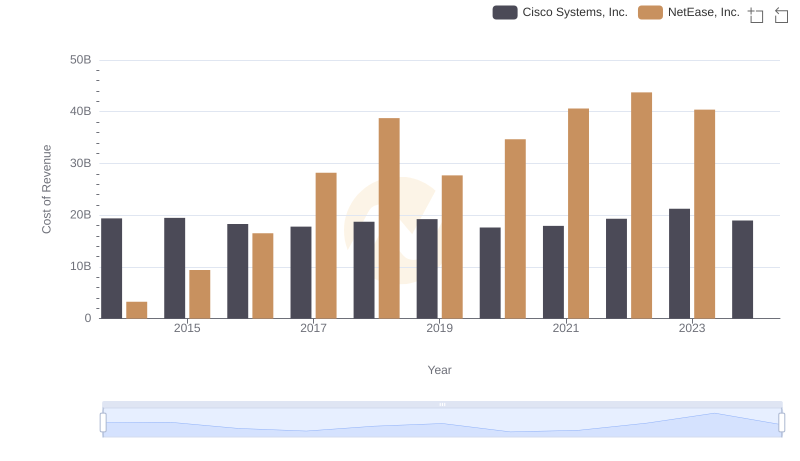
Cost of Revenue: Key Insights for Cisco Systems, Inc. and NetEase, Inc.

Cost of Revenue Comparison: Cisco Systems, Inc. vs Block, Inc.
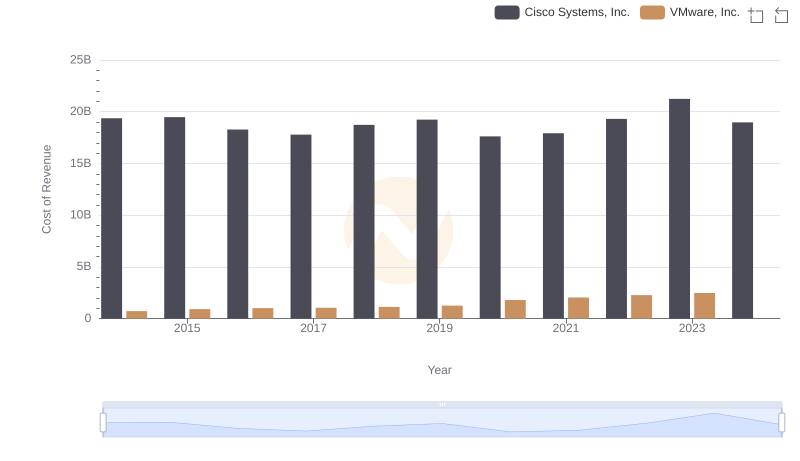
Analyzing Cost of Revenue: Cisco Systems, Inc. and VMware, Inc.
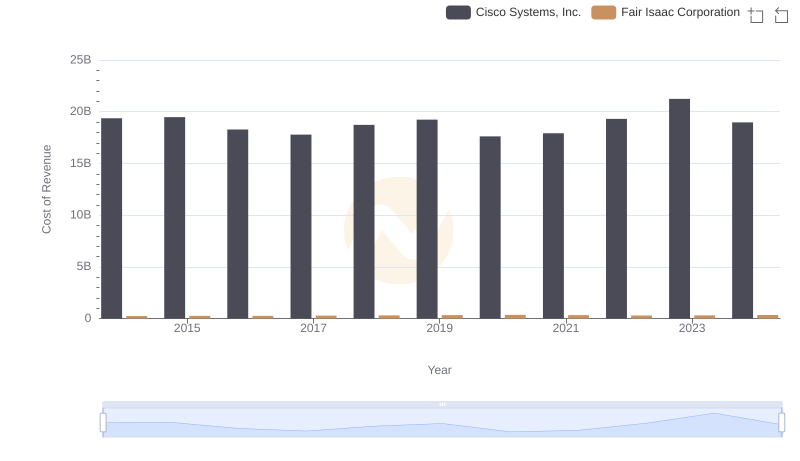
Cost Insights: Breaking Down Cisco Systems, Inc. and Fair Isaac Corporation's Expenses
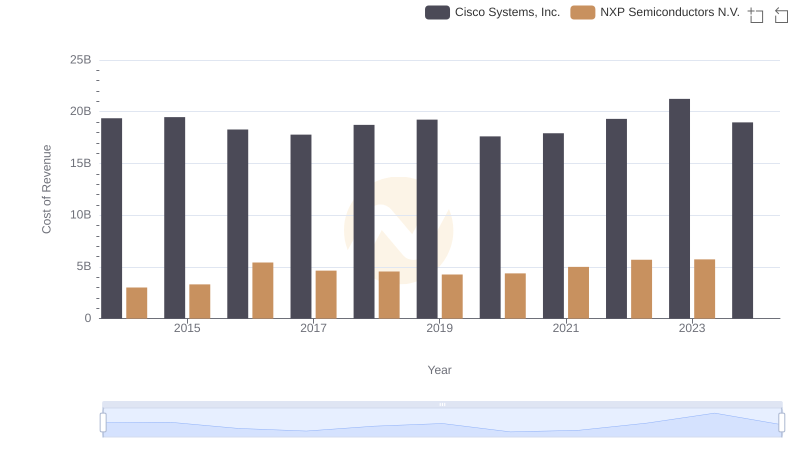
Analyzing Cost of Revenue: Cisco Systems, Inc. and NXP Semiconductors N.V.
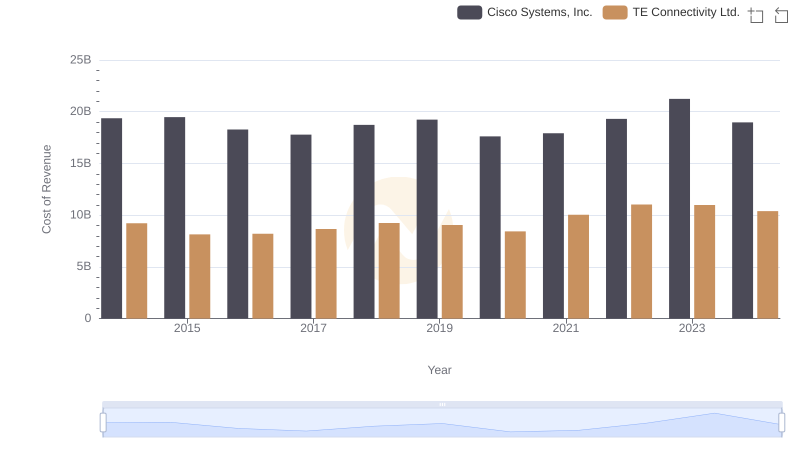
Cost of Revenue Trends: Cisco Systems, Inc. vs TE Connectivity Ltd.
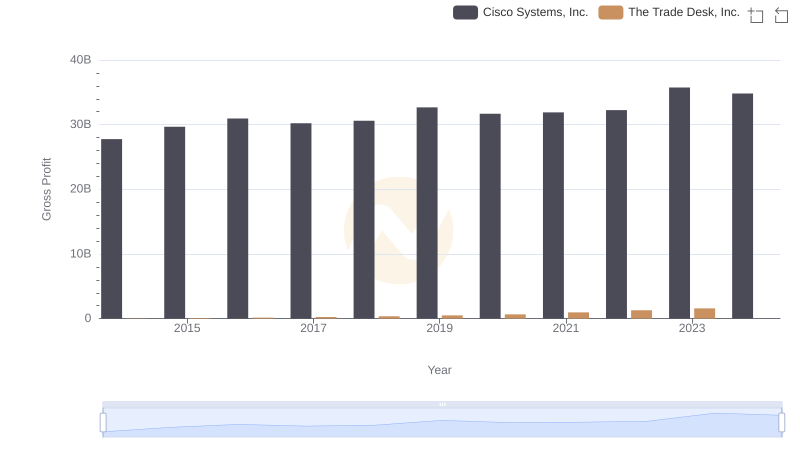
Gross Profit Analysis: Comparing Cisco Systems, Inc. and The Trade Desk, Inc.
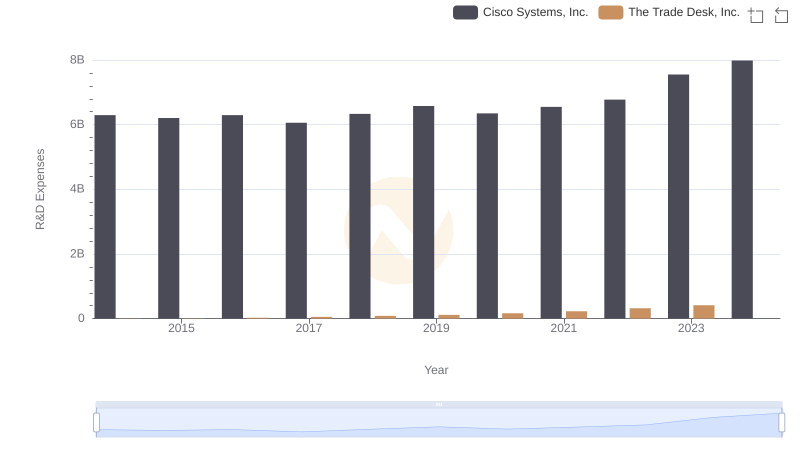
R&D Insights: How Cisco Systems, Inc. and The Trade Desk, Inc. Allocate Funds
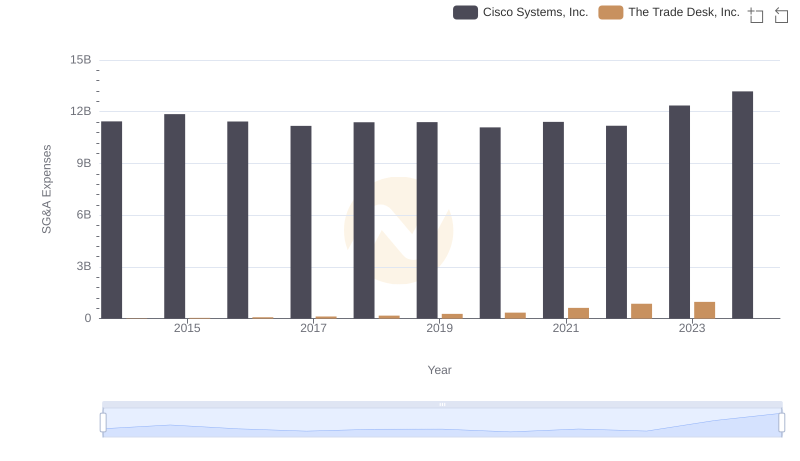
Cost Management Insights: SG&A Expenses for Cisco Systems, Inc. and The Trade Desk, Inc.
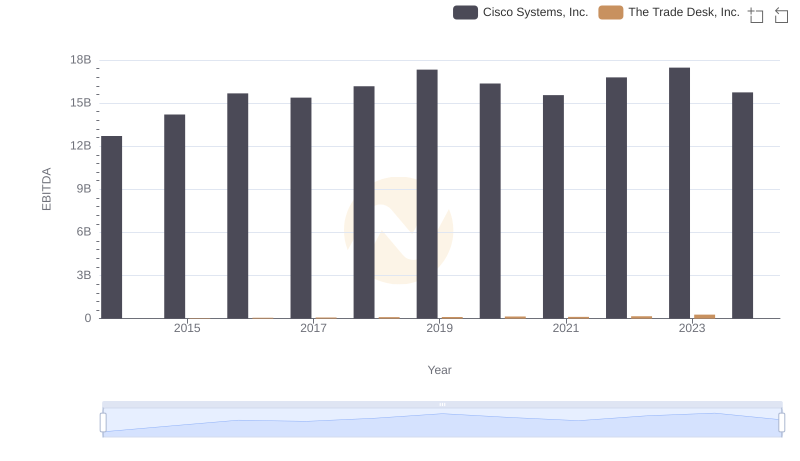
Professional EBITDA Benchmarking: Cisco Systems, Inc. vs The Trade Desk, Inc.