| __timestamp | Cisco Systems, Inc. | NXP Semiconductors N.V. |
|---|---|---|
| Wednesday, January 1, 2014 | 12709000000 | 1189000000 |
| Thursday, January 1, 2015 | 14209000000 | 2230000000 |
| Friday, January 1, 2016 | 15678000000 | 1921000000 |
| Sunday, January 1, 2017 | 15383000000 | 4196000000 |
| Monday, January 1, 2018 | 16172000000 | 4645000000 |
| Tuesday, January 1, 2019 | 17334000000 | 2719000000 |
| Wednesday, January 1, 2020 | 16363000000 | 2351000000 |
| Friday, January 1, 2021 | 15558000000 | 3811000000 |
| Saturday, January 1, 2022 | 16794000000 | 5040000000 |
| Sunday, January 1, 2023 | 17471000000 | 4896000000 |
| Monday, January 1, 2024 | 15747000000 |
In pursuit of knowledge
In the ever-evolving tech landscape, Cisco Systems, Inc. and NXP Semiconductors N.V. have been pivotal players. Over the past decade, Cisco's EBITDA has shown a steady upward trajectory, peaking in 2023 with a 37% increase from 2014. This growth underscores Cisco's robust market strategies and adaptability.
Conversely, NXP Semiconductors has experienced a more volatile journey. From 2014 to 2023, NXP's EBITDA surged by over 300%, reflecting its aggressive expansion and innovation in semiconductor technology. However, the data for 2024 remains incomplete, leaving room for speculation on NXP's future performance.
This comparative analysis highlights the contrasting growth patterns of these tech giants, offering insights into their strategic directions. As the tech industry continues to evolve, monitoring these trends will be crucial for investors and industry watchers alike.
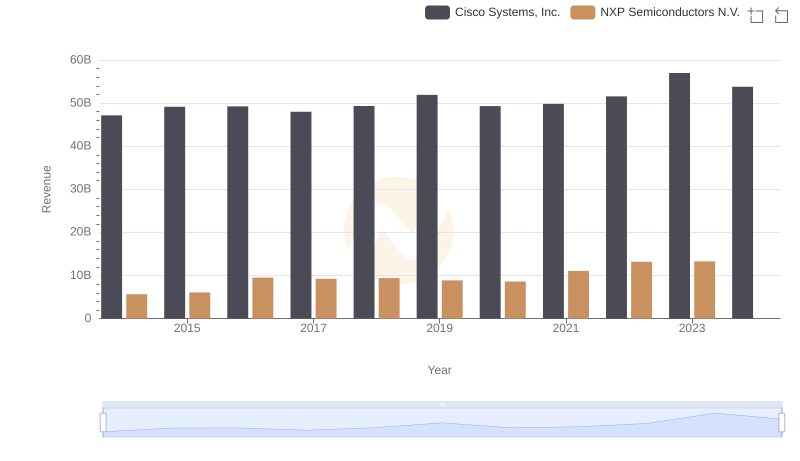
Cisco Systems, Inc. and NXP Semiconductors N.V.: A Comprehensive Revenue Analysis
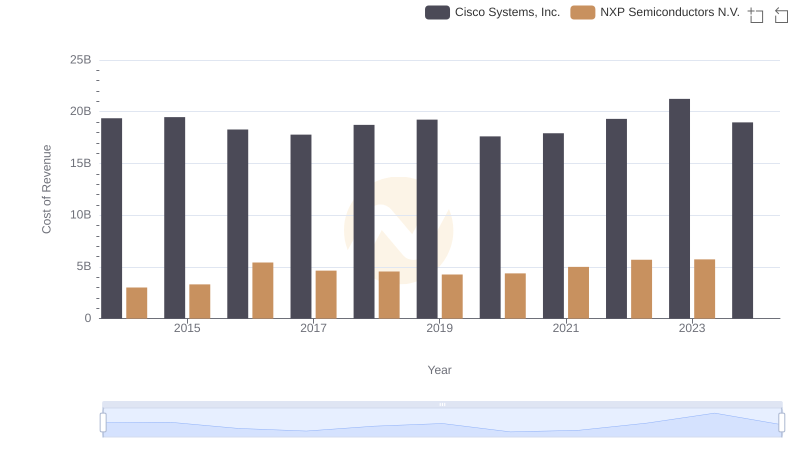
Analyzing Cost of Revenue: Cisco Systems, Inc. and NXP Semiconductors N.V.
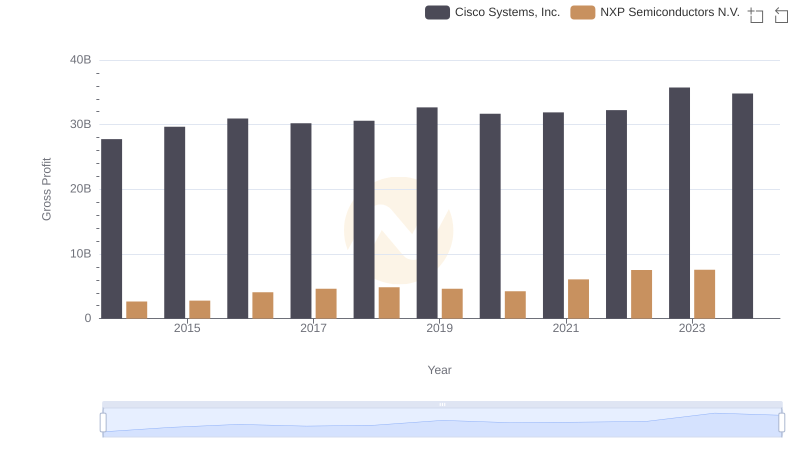
Key Insights on Gross Profit: Cisco Systems, Inc. vs NXP Semiconductors N.V.
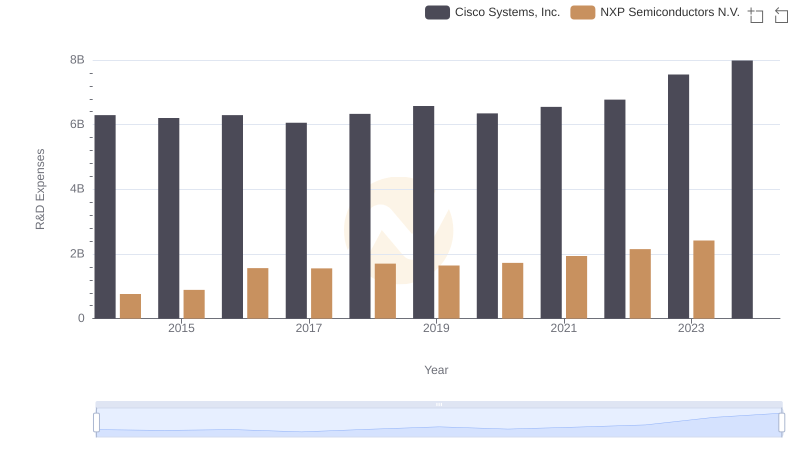
Research and Development: Comparing Key Metrics for Cisco Systems, Inc. and NXP Semiconductors N.V.
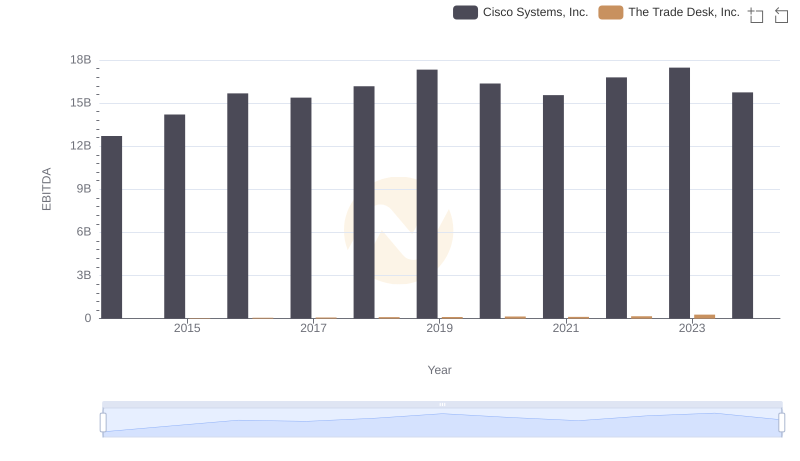
Professional EBITDA Benchmarking: Cisco Systems, Inc. vs The Trade Desk, Inc.
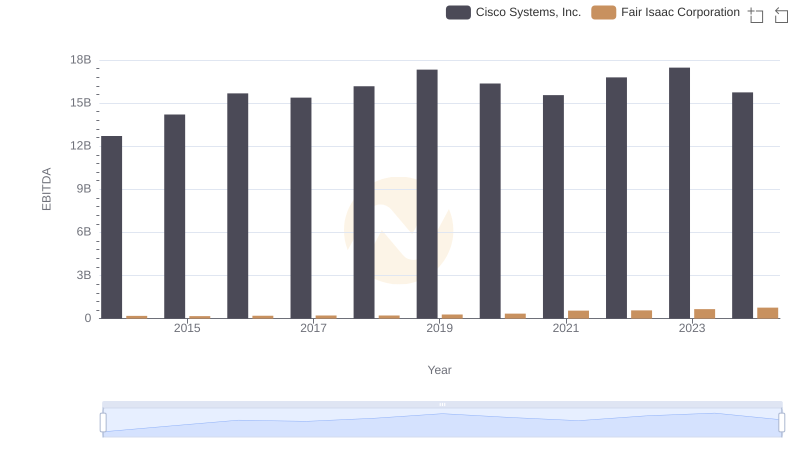
EBITDA Analysis: Evaluating Cisco Systems, Inc. Against Fair Isaac Corporation
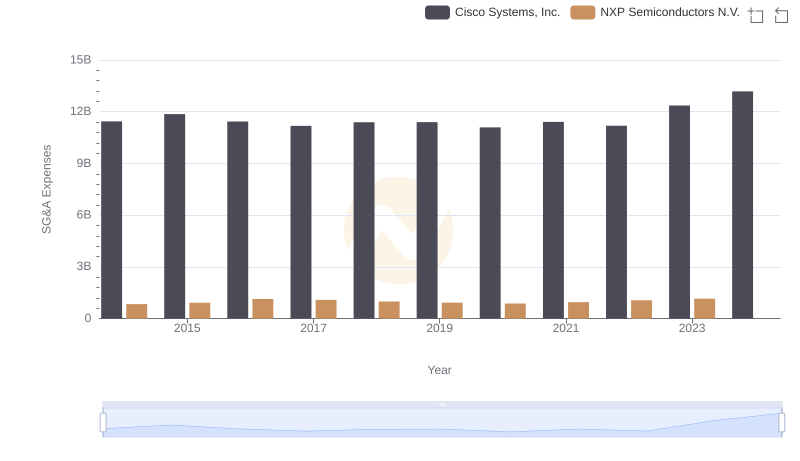
Cisco Systems, Inc. or NXP Semiconductors N.V.: Who Manages SG&A Costs Better?
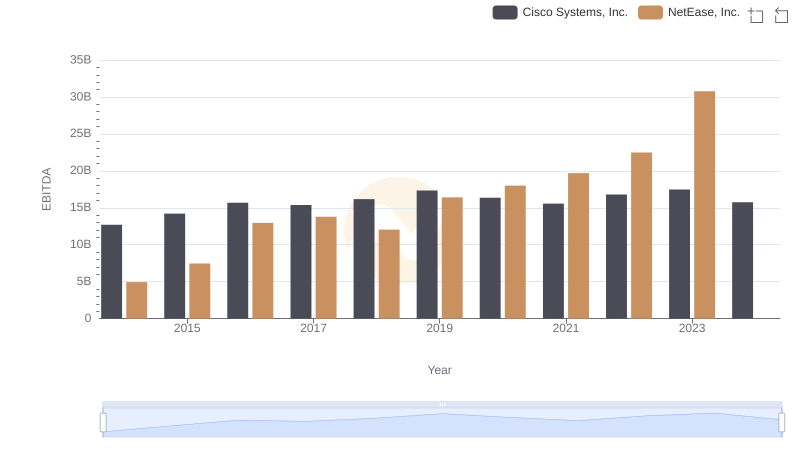
Comparative EBITDA Analysis: Cisco Systems, Inc. vs NetEase, Inc.
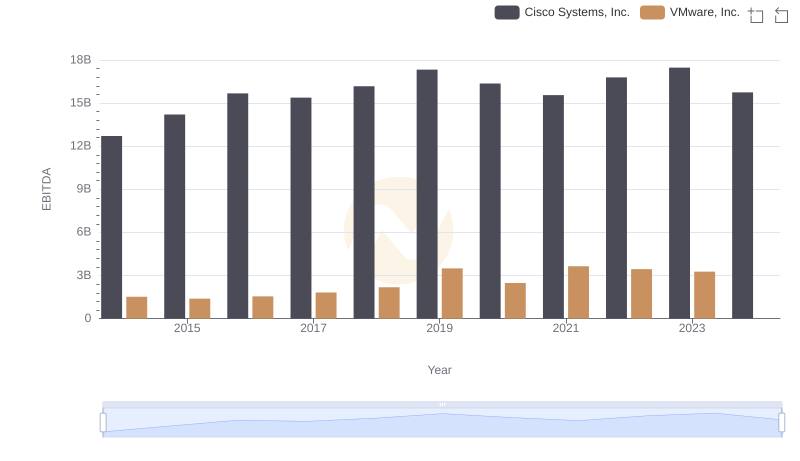
Cisco Systems, Inc. and VMware, Inc.: A Detailed Examination of EBITDA Performance
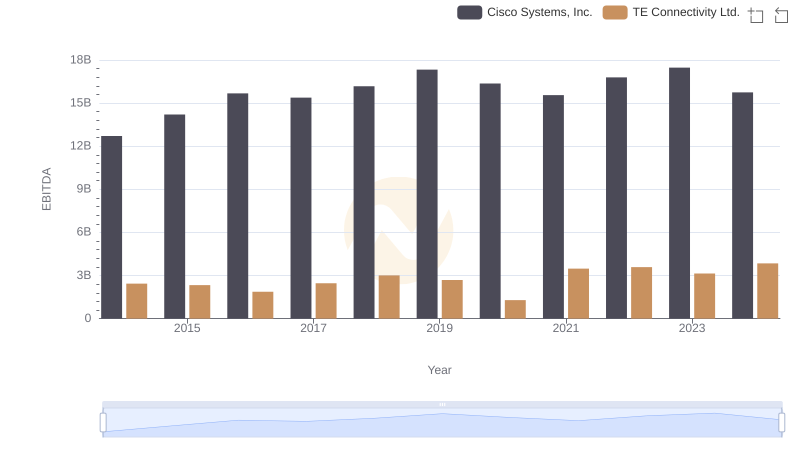
Professional EBITDA Benchmarking: Cisco Systems, Inc. vs TE Connectivity Ltd.
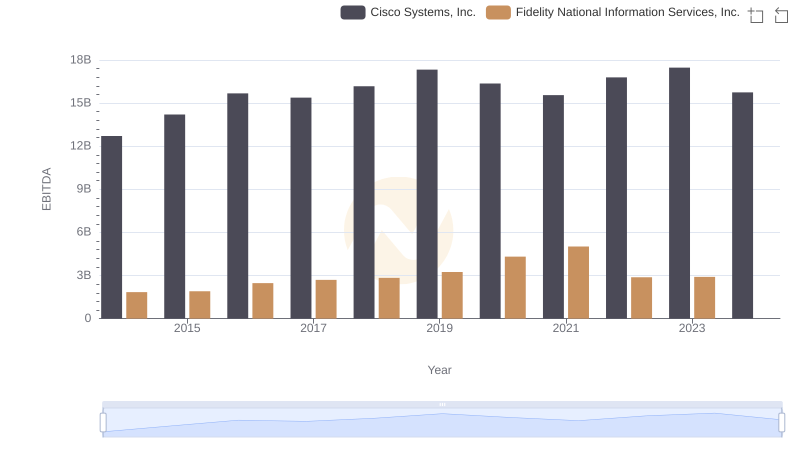
Comprehensive EBITDA Comparison: Cisco Systems, Inc. vs Fidelity National Information Services, Inc.
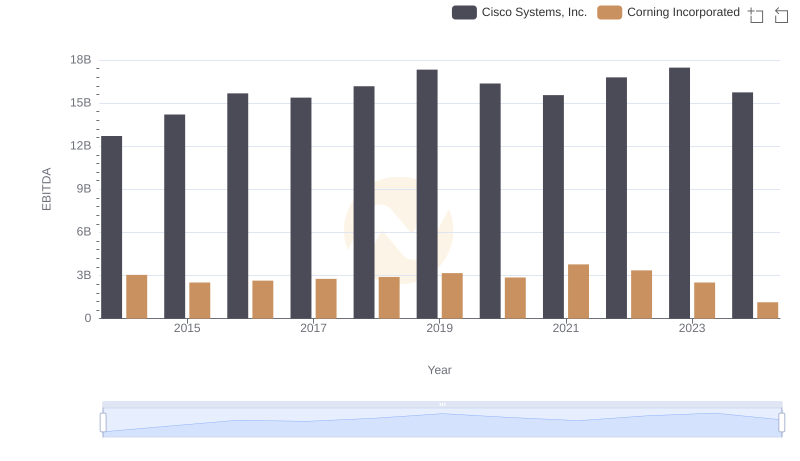
Cisco Systems, Inc. vs Corning Incorporated: In-Depth EBITDA Performance Comparison