| __timestamp | Cisco Systems, Inc. | NetEase, Inc. |
|---|---|---|
| Wednesday, January 1, 2014 | 12709000000 | 4939587000 |
| Thursday, January 1, 2015 | 14209000000 | 7454573000 |
| Friday, January 1, 2016 | 15678000000 | 12956379000 |
| Sunday, January 1, 2017 | 15383000000 | 13786691000 |
| Monday, January 1, 2018 | 16172000000 | 12037479000 |
| Tuesday, January 1, 2019 | 17334000000 | 16404433000 |
| Wednesday, January 1, 2020 | 16363000000 | 17996187000 |
| Friday, January 1, 2021 | 15558000000 | 19692797000 |
| Saturday, January 1, 2022 | 16794000000 | 22486802000 |
| Sunday, January 1, 2023 | 17471000000 | 30764404000 |
| Monday, January 1, 2024 | 15747000000 |
Cracking the code
In the ever-evolving tech landscape, Cisco Systems, Inc. and NetEase, Inc. have showcased remarkable financial trajectories over the past decade. From 2014 to 2023, Cisco's EBITDA grew by approximately 37%, peaking in 2023. Meanwhile, NetEase's EBITDA surged by an impressive 523%, reflecting its dynamic growth strategy and market expansion.
Cisco's EBITDA journey reflects a consistent upward trend, with a notable 14% increase from 2014 to 2019. Despite a slight dip in 2020, Cisco rebounded, achieving its highest EBITDA in 2023.
NetEase, on the other hand, experienced exponential growth, particularly from 2019 onwards, with a staggering 87% increase in EBITDA from 2020 to 2023. This growth underscores NetEase's strategic positioning in the digital entertainment sector.
As we look to the future, these trends highlight the contrasting yet successful strategies of these tech giants.
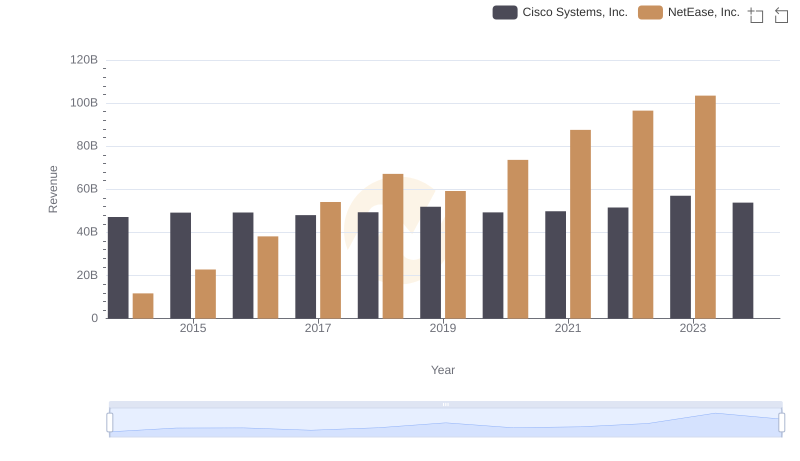
Annual Revenue Comparison: Cisco Systems, Inc. vs NetEase, Inc.
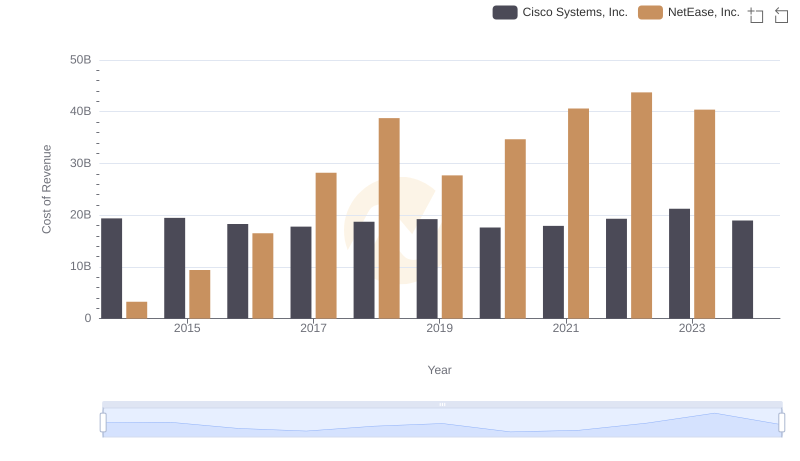
Cost of Revenue: Key Insights for Cisco Systems, Inc. and NetEase, Inc.
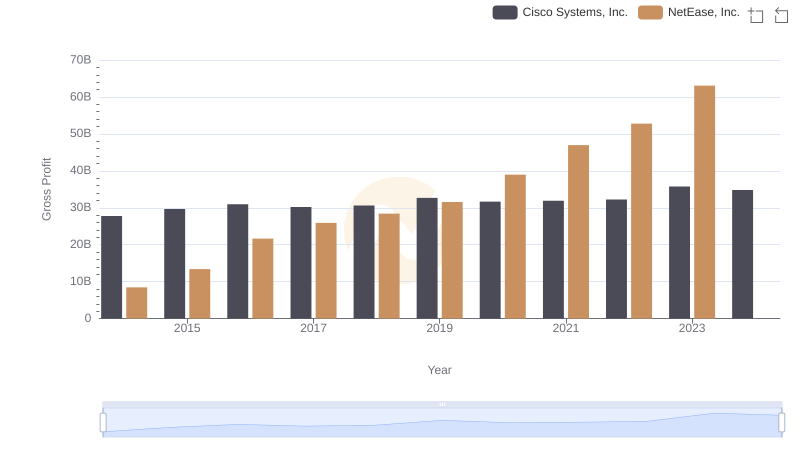
Gross Profit Comparison: Cisco Systems, Inc. and NetEase, Inc. Trends
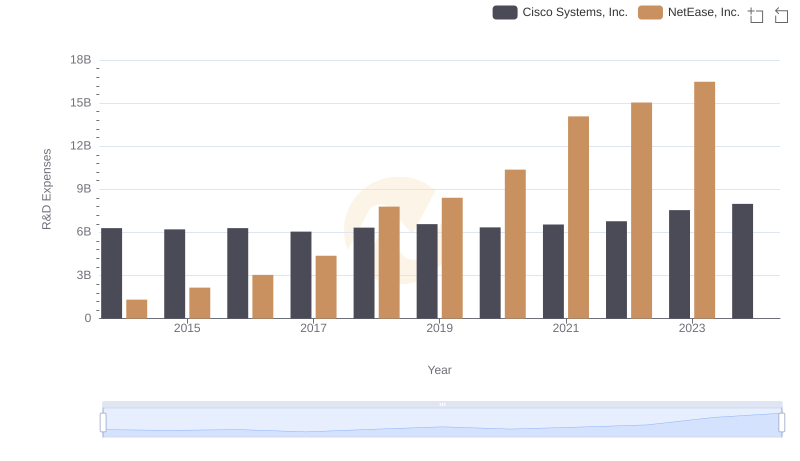
Research and Development: Comparing Key Metrics for Cisco Systems, Inc. and NetEase, Inc.
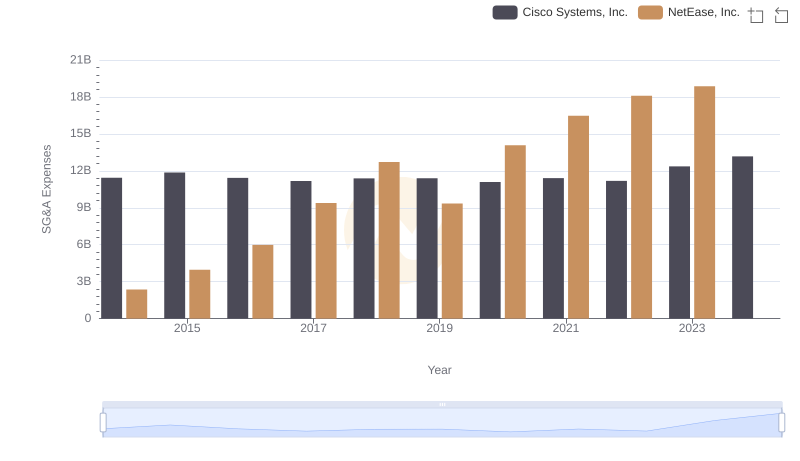
Selling, General, and Administrative Costs: Cisco Systems, Inc. vs NetEase, Inc.
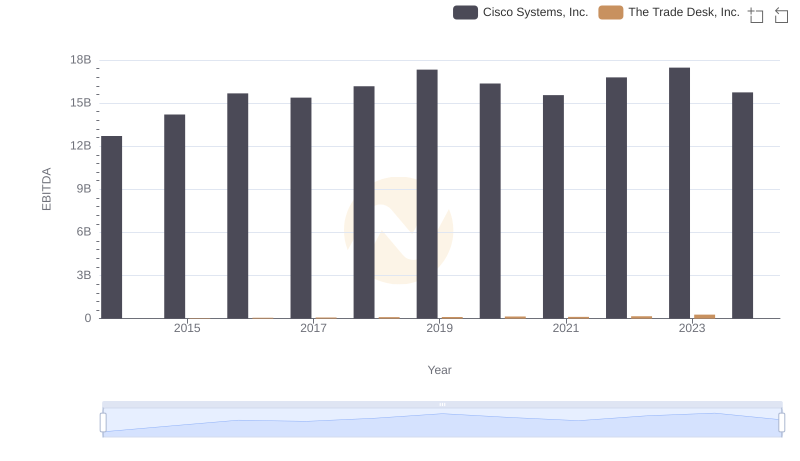
Professional EBITDA Benchmarking: Cisco Systems, Inc. vs The Trade Desk, Inc.
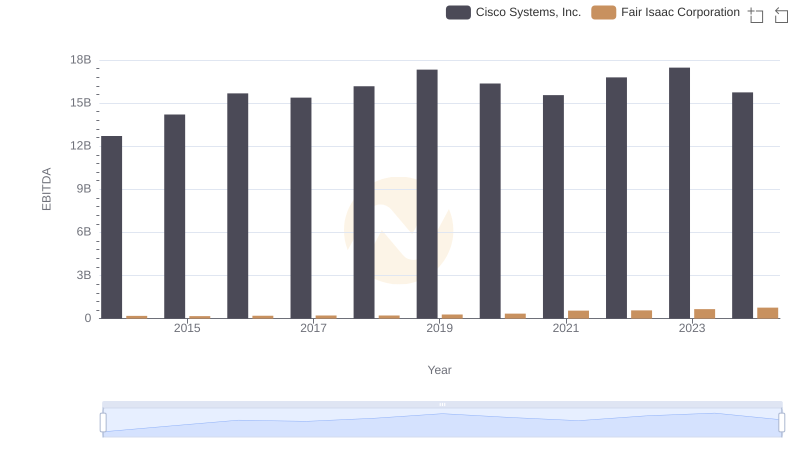
EBITDA Analysis: Evaluating Cisco Systems, Inc. Against Fair Isaac Corporation
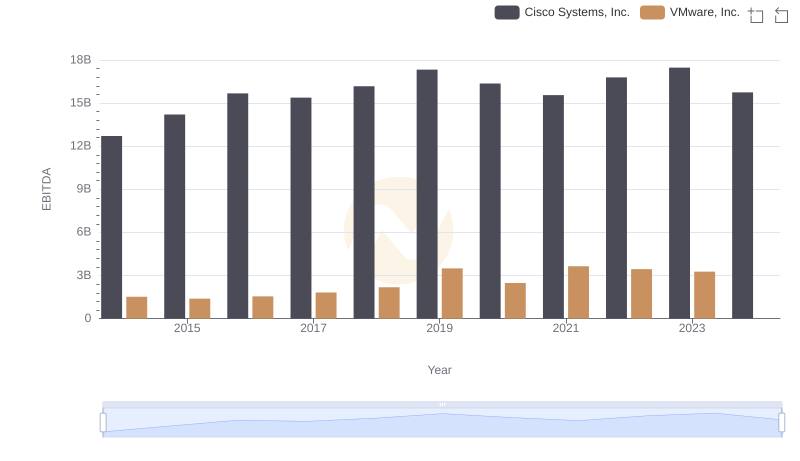
Cisco Systems, Inc. and VMware, Inc.: A Detailed Examination of EBITDA Performance
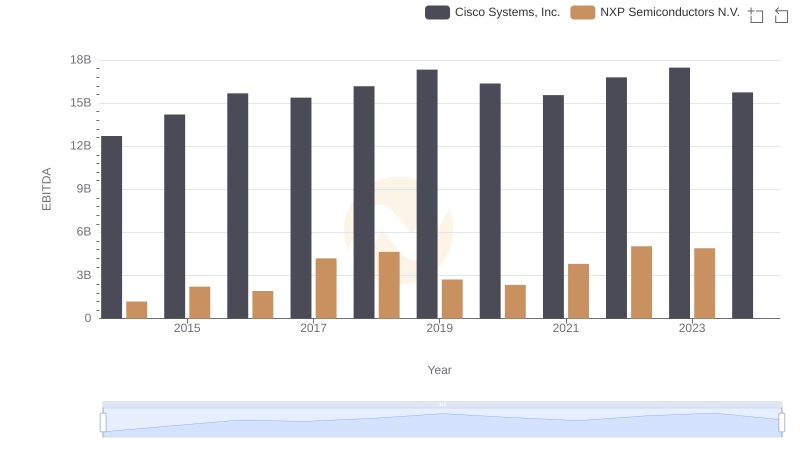
Comparative EBITDA Analysis: Cisco Systems, Inc. vs NXP Semiconductors N.V.
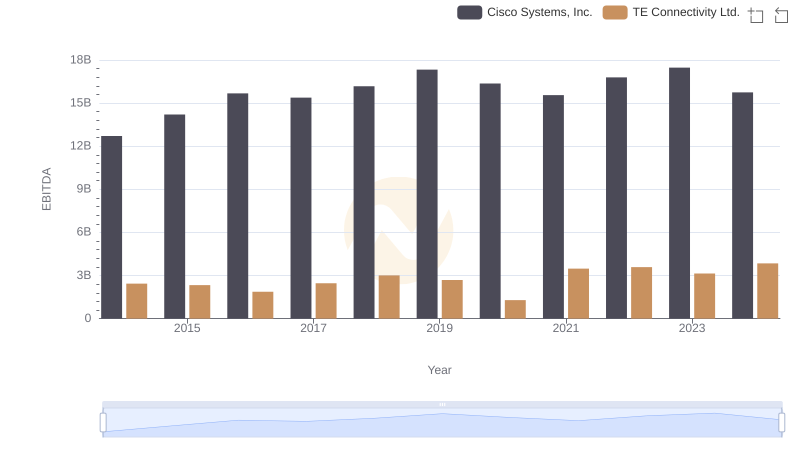
Professional EBITDA Benchmarking: Cisco Systems, Inc. vs TE Connectivity Ltd.
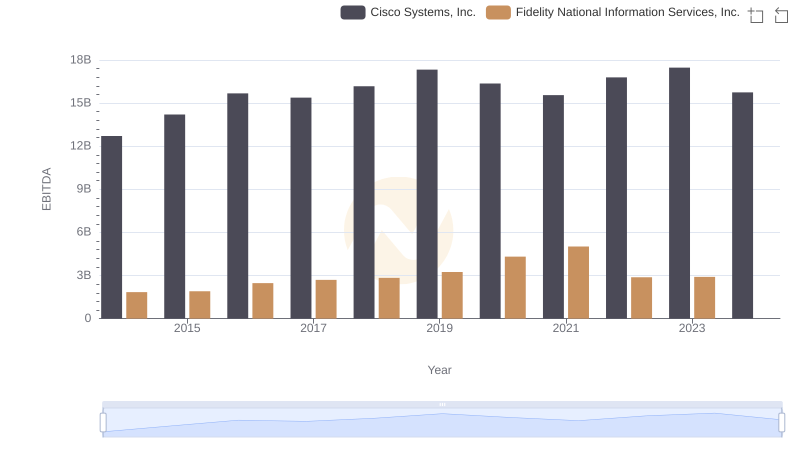
Comprehensive EBITDA Comparison: Cisco Systems, Inc. vs Fidelity National Information Services, Inc.
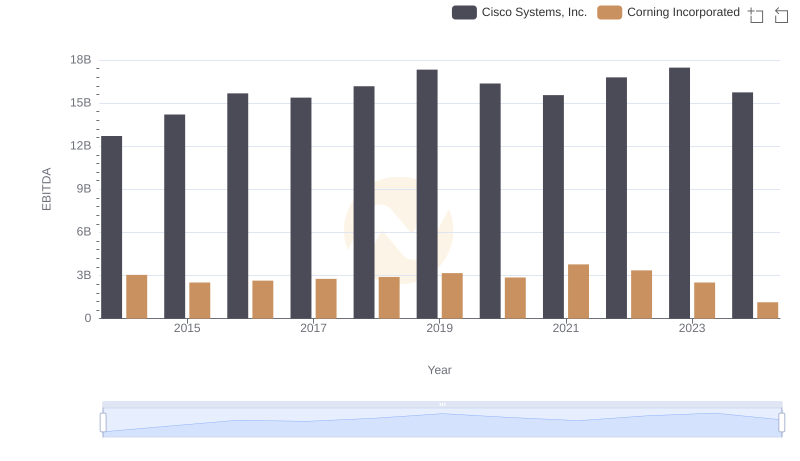
Cisco Systems, Inc. vs Corning Incorporated: In-Depth EBITDA Performance Comparison