| __timestamp | Cisco Systems, Inc. | VMware, Inc. |
|---|---|---|
| Wednesday, January 1, 2014 | 12709000000 | 1526000000 |
| Thursday, January 1, 2015 | 14209000000 | 1395000000 |
| Friday, January 1, 2016 | 15678000000 | 1548000000 |
| Sunday, January 1, 2017 | 15383000000 | 1819000000 |
| Monday, January 1, 2018 | 16172000000 | 2181000000 |
| Tuesday, January 1, 2019 | 17334000000 | 3495000000 |
| Wednesday, January 1, 2020 | 16363000000 | 2479000000 |
| Friday, January 1, 2021 | 15558000000 | 3646000000 |
| Saturday, January 1, 2022 | 16794000000 | 3446000000 |
| Sunday, January 1, 2023 | 17471000000 | 3273000000 |
| Monday, January 1, 2024 | 15747000000 |
In pursuit of knowledge
In the ever-evolving tech industry, understanding financial performance is crucial. Cisco Systems, Inc. and VMware, Inc. have been pivotal players, each showcasing unique EBITDA trajectories from 2014 to 2023. Cisco's EBITDA grew by approximately 37% over this period, peaking in 2023, while VMware's EBITDA saw a remarkable 114% increase, reaching its zenith in 2021. This growth highlights VMware's aggressive expansion strategy compared to Cisco's steady climb. However, 2024 data for VMware is missing, leaving room for speculation on its future performance. This analysis underscores the dynamic nature of the tech sector, where strategic decisions significantly impact financial outcomes. As we look to the future, these trends offer valuable insights for investors and industry analysts alike.
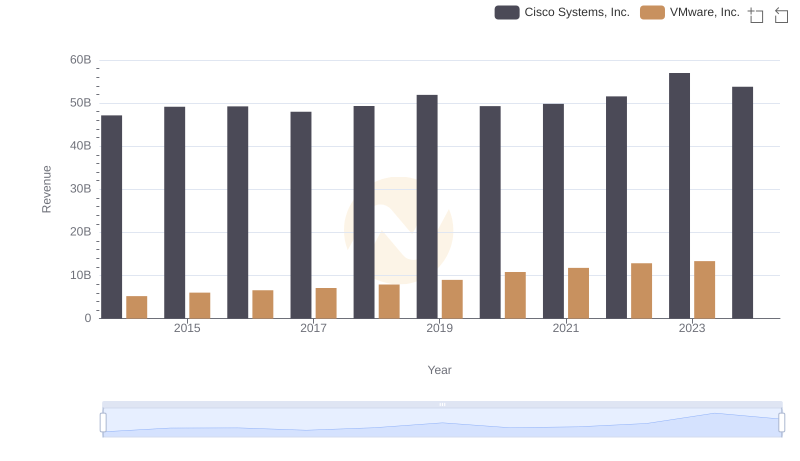
Annual Revenue Comparison: Cisco Systems, Inc. vs VMware, Inc.
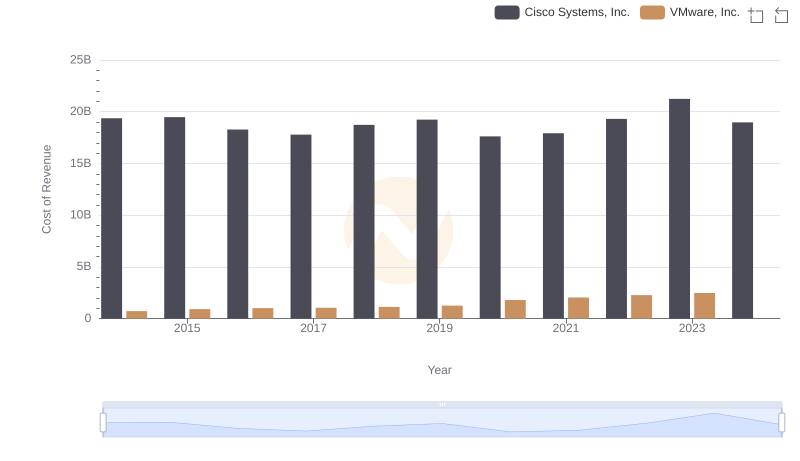
Analyzing Cost of Revenue: Cisco Systems, Inc. and VMware, Inc.
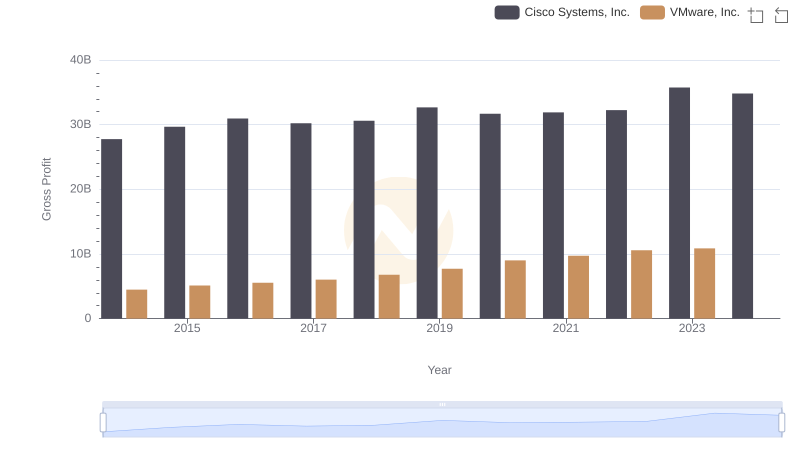
Cisco Systems, Inc. vs VMware, Inc.: A Gross Profit Performance Breakdown
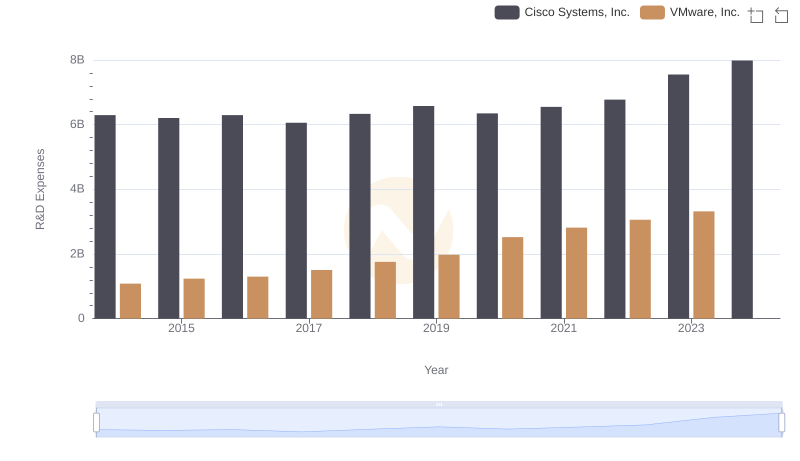
Cisco Systems, Inc. or VMware, Inc.: Who Invests More in Innovation?
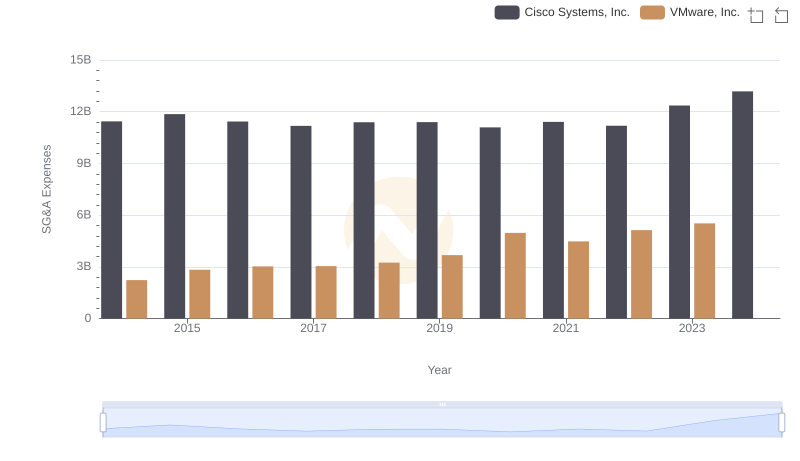
Cost Management Insights: SG&A Expenses for Cisco Systems, Inc. and VMware, Inc.
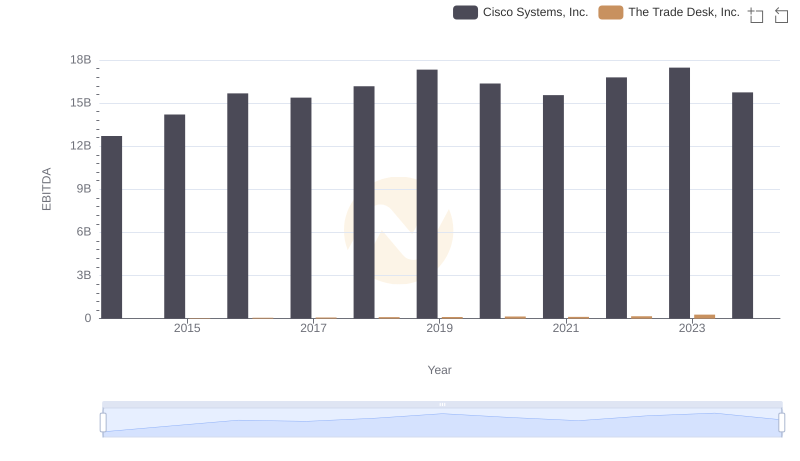
Professional EBITDA Benchmarking: Cisco Systems, Inc. vs The Trade Desk, Inc.
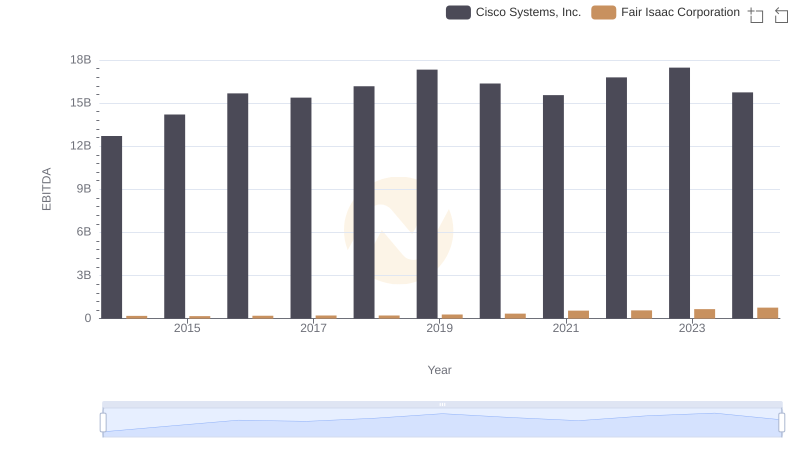
EBITDA Analysis: Evaluating Cisco Systems, Inc. Against Fair Isaac Corporation
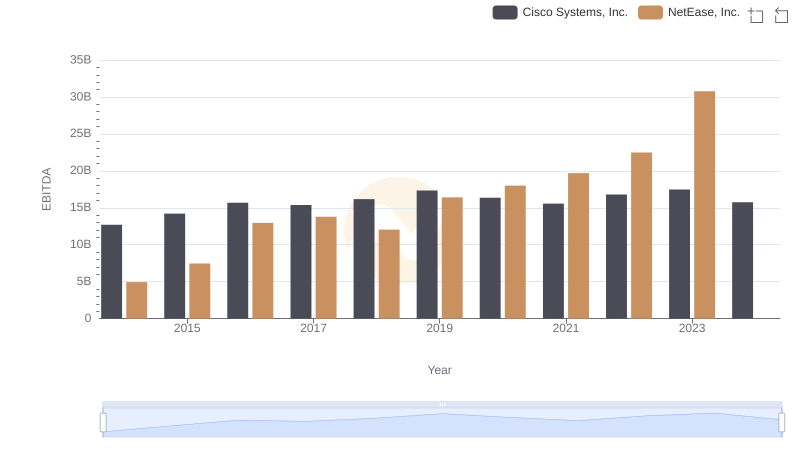
Comparative EBITDA Analysis: Cisco Systems, Inc. vs NetEase, Inc.
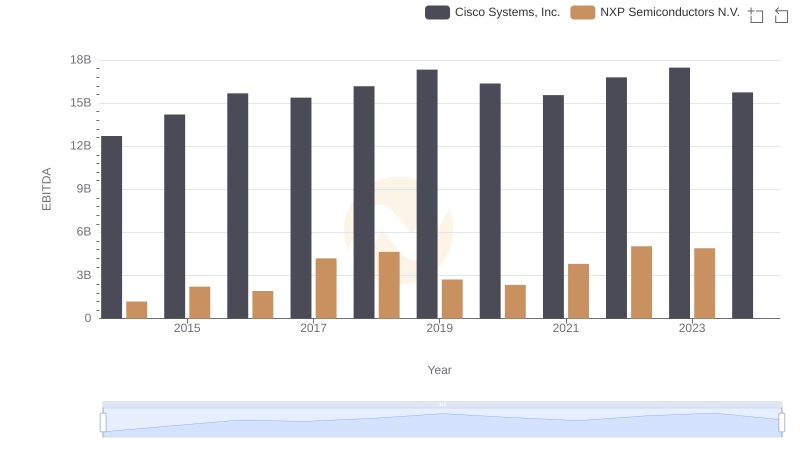
Comparative EBITDA Analysis: Cisco Systems, Inc. vs NXP Semiconductors N.V.
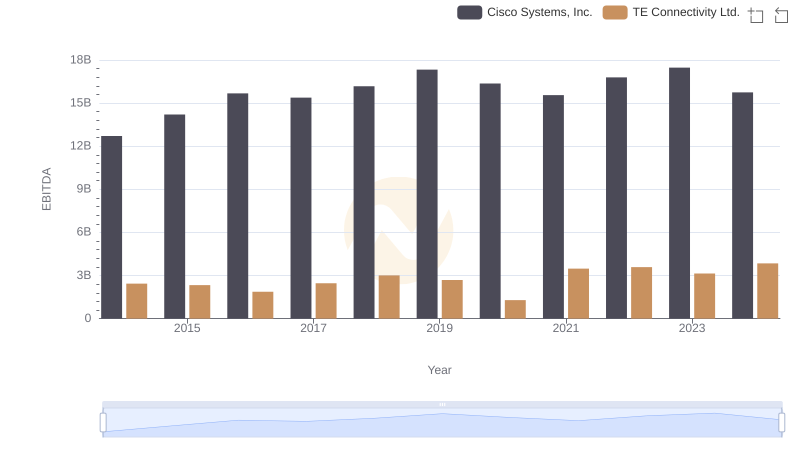
Professional EBITDA Benchmarking: Cisco Systems, Inc. vs TE Connectivity Ltd.
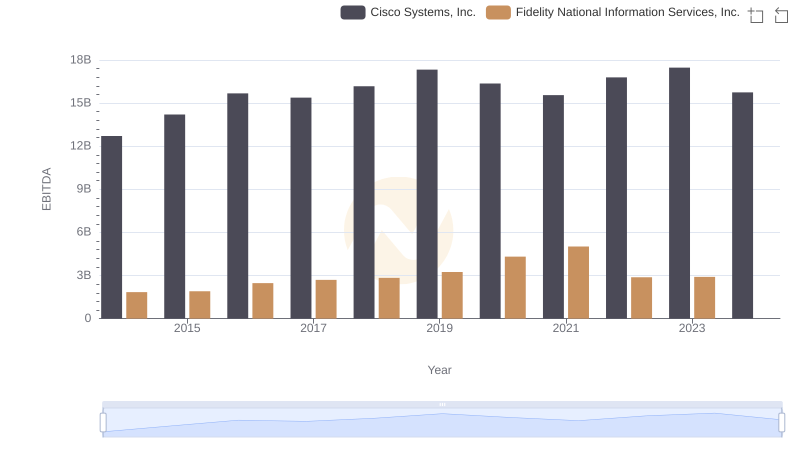
Comprehensive EBITDA Comparison: Cisco Systems, Inc. vs Fidelity National Information Services, Inc.
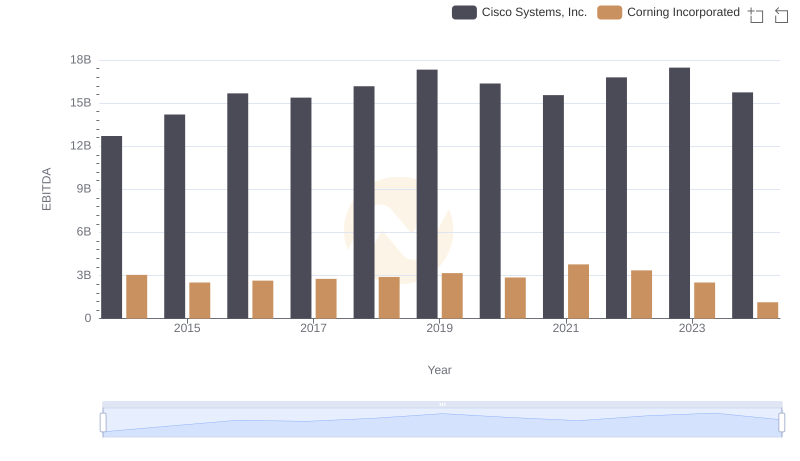
Cisco Systems, Inc. vs Corning Incorporated: In-Depth EBITDA Performance Comparison