| __timestamp | Cisco Systems, Inc. | The Trade Desk, Inc. |
|---|---|---|
| Wednesday, January 1, 2014 | 11437000000 | 23975000 |
| Thursday, January 1, 2015 | 11861000000 | 40070000 |
| Friday, January 1, 2016 | 11433000000 | 78219000 |
| Sunday, January 1, 2017 | 11177000000 | 119825000 |
| Monday, January 1, 2018 | 11386000000 | 171981000 |
| Tuesday, January 1, 2019 | 11398000000 | 275930000 |
| Wednesday, January 1, 2020 | 11094000000 | 346359000 |
| Friday, January 1, 2021 | 11411000000 | 623959000 |
| Saturday, January 1, 2022 | 11186000000 | 863142000 |
| Sunday, January 1, 2023 | 12358000000 | 968248000 |
| Monday, January 1, 2024 | 13177000000 | 1082333000 |
In pursuit of knowledge
In the ever-evolving landscape of corporate finance, understanding Selling, General, and Administrative (SG&A) expenses is crucial for effective cost management. Cisco Systems, Inc. and The Trade Desk, Inc. offer a fascinating contrast in this regard. Over the past decade, Cisco's SG&A expenses have shown a steady trend, averaging around $11.6 billion annually, with a notable increase of 14% from 2022 to 2024. Meanwhile, The Trade Desk, a rising star in the digital advertising space, has seen its SG&A expenses grow exponentially, reflecting its rapid expansion. From a modest $24 million in 2014, The Trade Desk's expenses surged to nearly $968 million by 2023, marking a staggering 40-fold increase. This data highlights the dynamic nature of SG&A expenses and underscores the importance of strategic financial planning in navigating growth and competition.
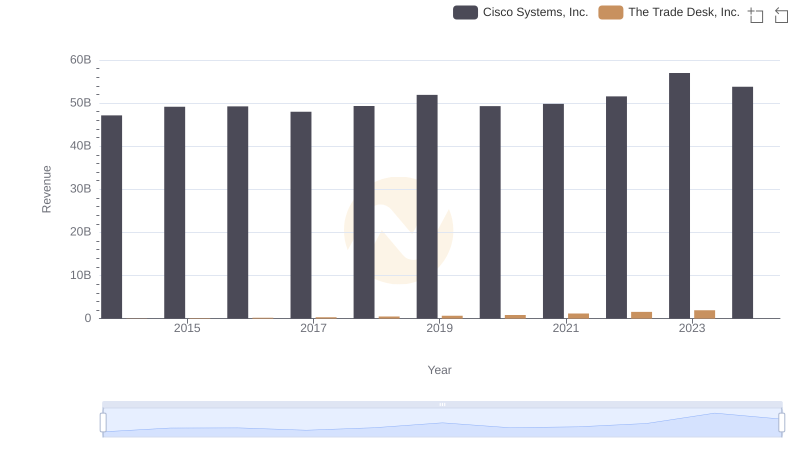
Cisco Systems, Inc. or The Trade Desk, Inc.: Who Leads in Yearly Revenue?
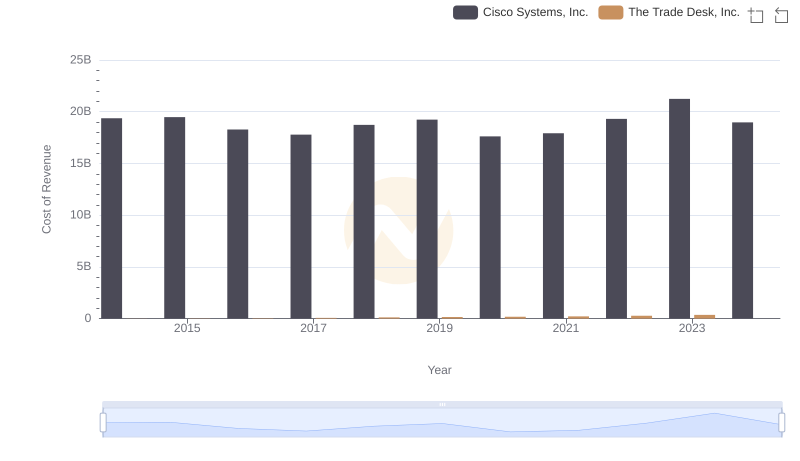
Cost of Revenue Trends: Cisco Systems, Inc. vs The Trade Desk, Inc.
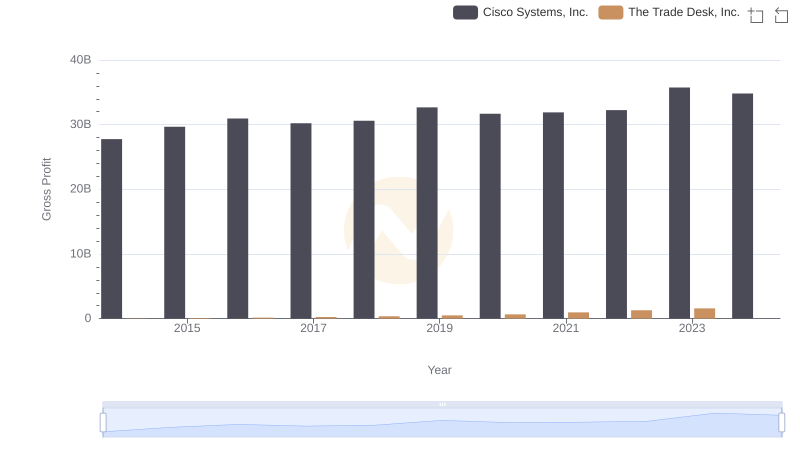
Gross Profit Analysis: Comparing Cisco Systems, Inc. and The Trade Desk, Inc.
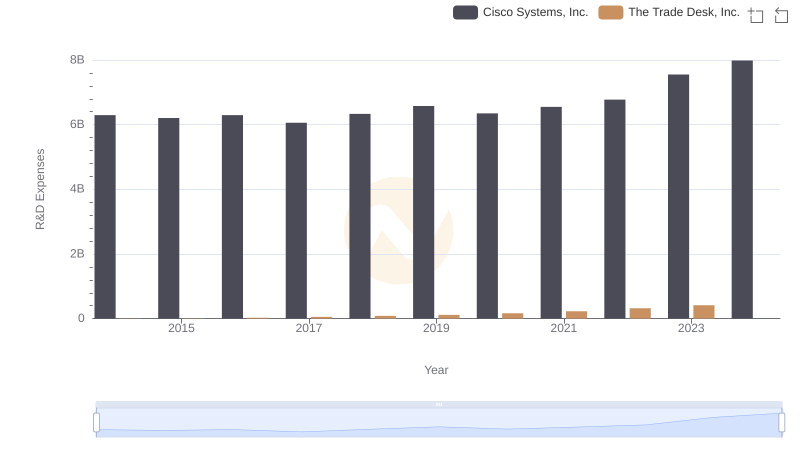
R&D Insights: How Cisco Systems, Inc. and The Trade Desk, Inc. Allocate Funds
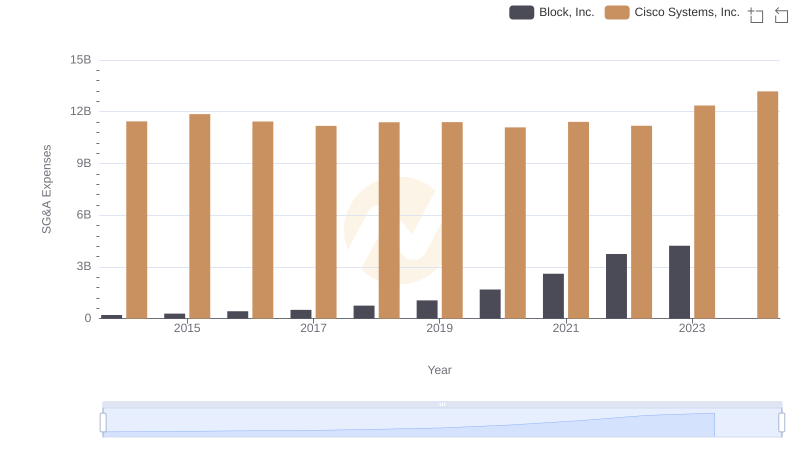
SG&A Efficiency Analysis: Comparing Cisco Systems, Inc. and Block, Inc.
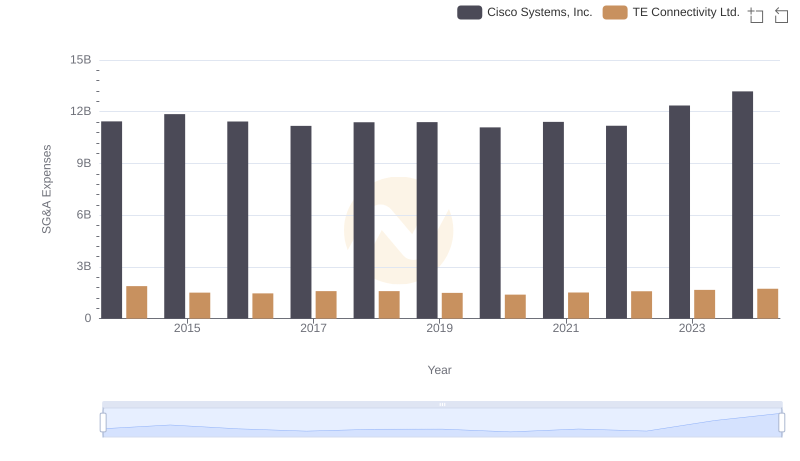
Who Optimizes SG&A Costs Better? Cisco Systems, Inc. or TE Connectivity Ltd.
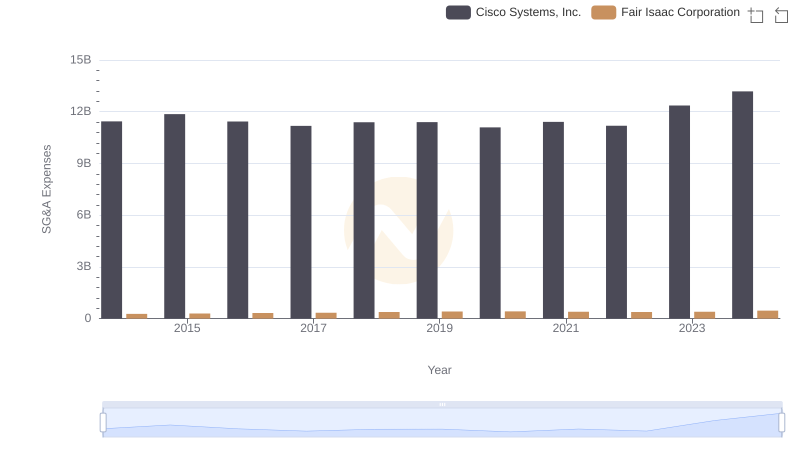
SG&A Efficiency Analysis: Comparing Cisco Systems, Inc. and Fair Isaac Corporation
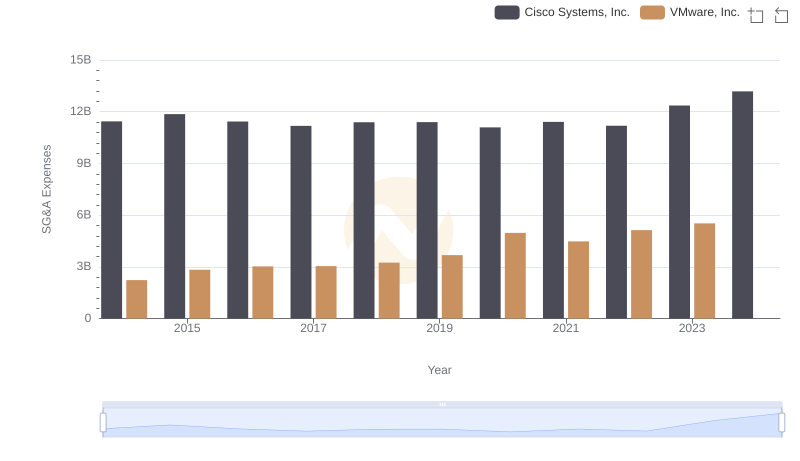
Cost Management Insights: SG&A Expenses for Cisco Systems, Inc. and VMware, Inc.
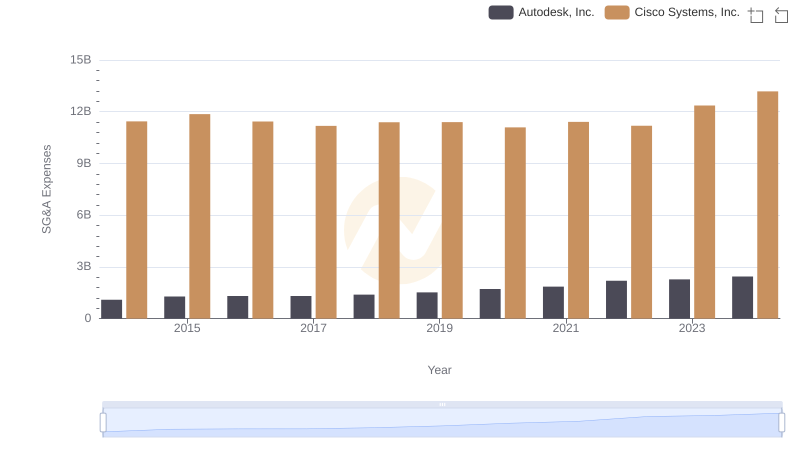
Breaking Down SG&A Expenses: Cisco Systems, Inc. vs Autodesk, Inc.
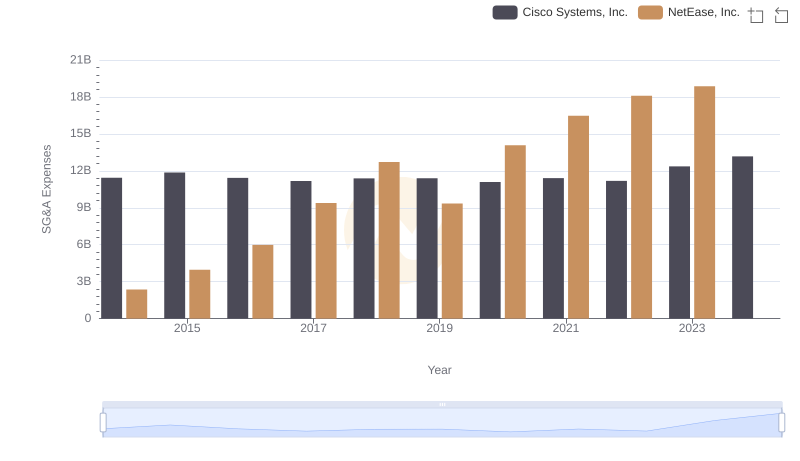
Selling, General, and Administrative Costs: Cisco Systems, Inc. vs NetEase, Inc.
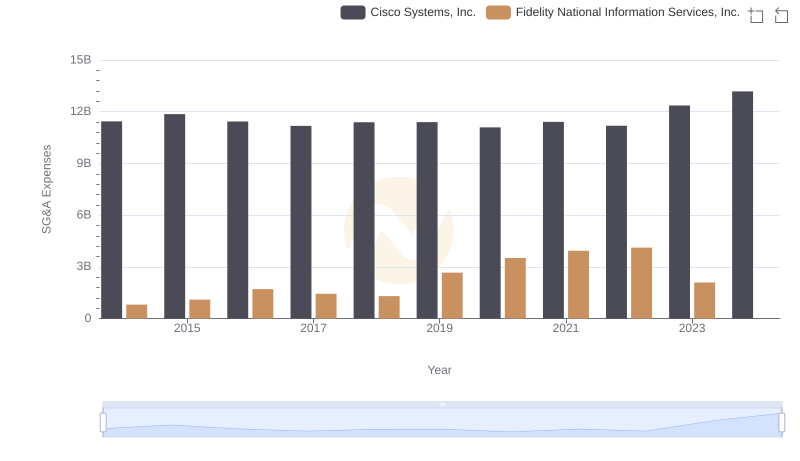
Breaking Down SG&A Expenses: Cisco Systems, Inc. vs Fidelity National Information Services, Inc.
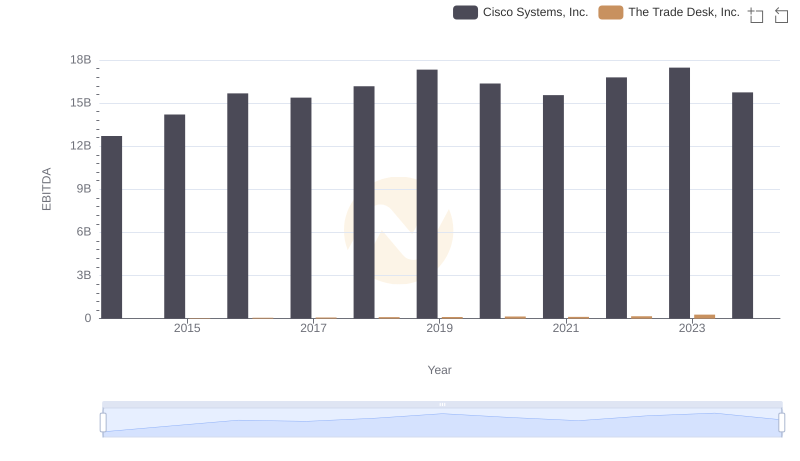
Professional EBITDA Benchmarking: Cisco Systems, Inc. vs The Trade Desk, Inc.