| __timestamp | Cisco Systems, Inc. | The Trade Desk, Inc. |
|---|---|---|
| Wednesday, January 1, 2014 | 27769000000 | 31989000 |
| Thursday, January 1, 2015 | 29681000000 | 90869000 |
| Friday, January 1, 2016 | 30960000000 | 163050000 |
| Sunday, January 1, 2017 | 30224000000 | 241987000 |
| Monday, January 1, 2018 | 30606000000 | 363196000 |
| Tuesday, January 1, 2019 | 32666000000 | 504878000 |
| Wednesday, January 1, 2020 | 31683000000 | 657221000 |
| Friday, January 1, 2021 | 31894000000 | 974913000 |
| Saturday, January 1, 2022 | 32248000000 | 1296672000 |
| Sunday, January 1, 2023 | 35753000000 | 1580522000 |
| Monday, January 1, 2024 | 34828000000 | 1972819000 |
In pursuit of knowledge
In the ever-evolving tech industry, understanding financial performance is crucial. Cisco Systems, Inc., a stalwart in networking, and The Trade Desk, Inc., a rising star in digital advertising, offer a fascinating contrast in gross profit trends from 2014 to 2023. Cisco's gross profit has shown a steady increase, peaking at approximately $35.8 billion in 2023, reflecting a robust growth of around 29% over the decade. In contrast, The Trade Desk, starting from a modest base, has experienced exponential growth, with its gross profit surging by over 4,800% to reach $1.58 billion in 2023. This remarkable growth underscores the dynamic nature of digital advertising. However, data for 2024 is incomplete, highlighting the need for ongoing analysis. These insights provide a window into the strategic maneuvers of these tech giants, offering valuable lessons for investors and industry watchers alike.
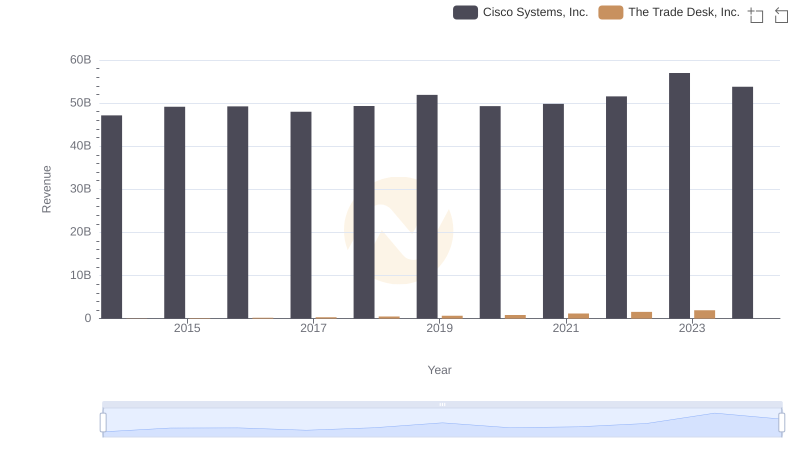
Cisco Systems, Inc. or The Trade Desk, Inc.: Who Leads in Yearly Revenue?
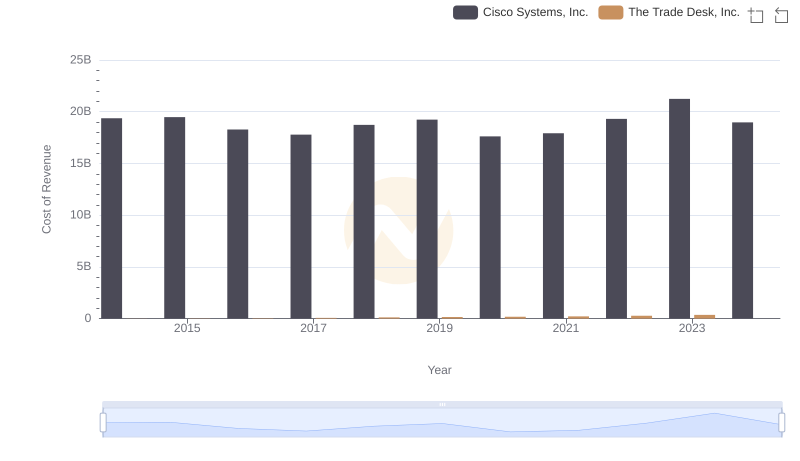
Cost of Revenue Trends: Cisco Systems, Inc. vs The Trade Desk, Inc.
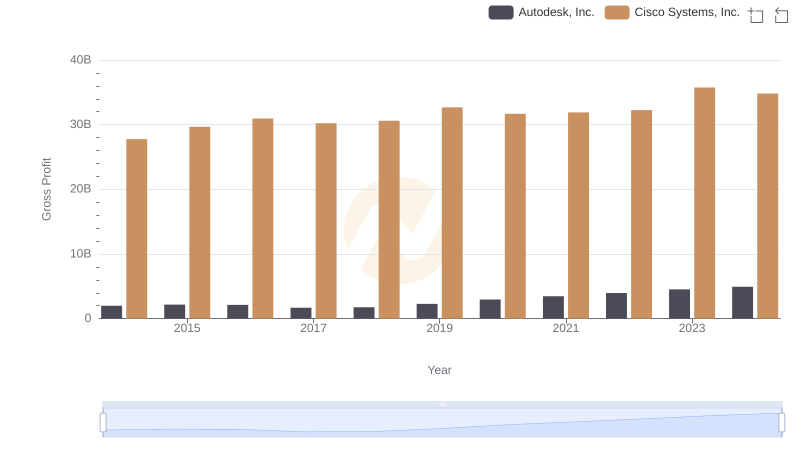
Gross Profit Analysis: Comparing Cisco Systems, Inc. and Autodesk, Inc.
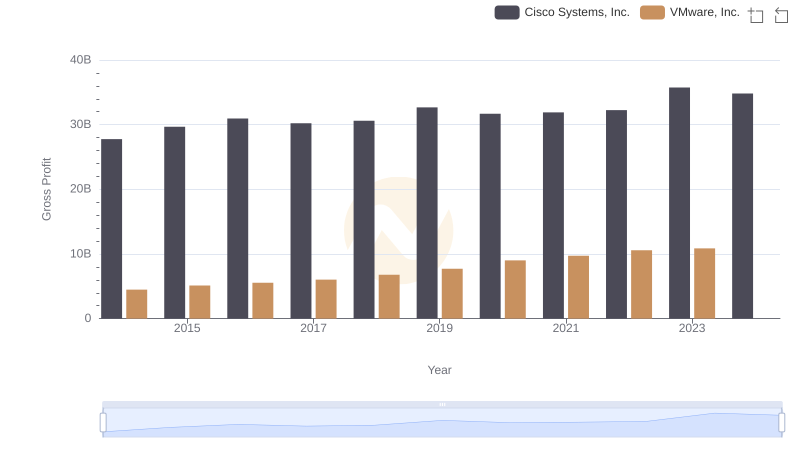
Cisco Systems, Inc. vs VMware, Inc.: A Gross Profit Performance Breakdown
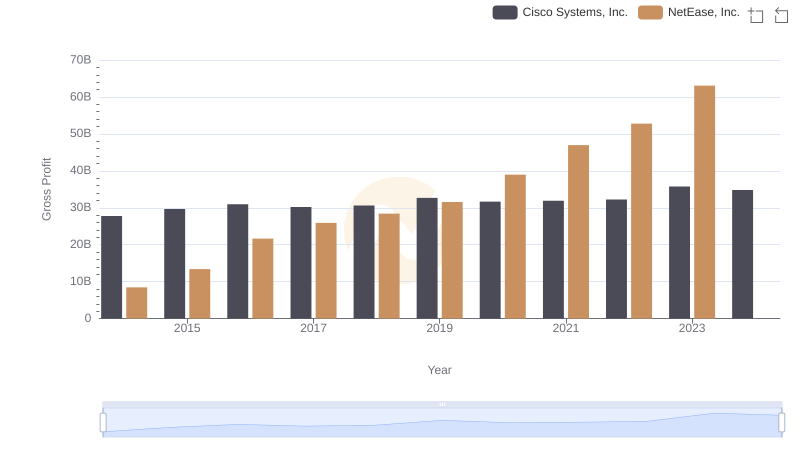
Gross Profit Comparison: Cisco Systems, Inc. and NetEase, Inc. Trends
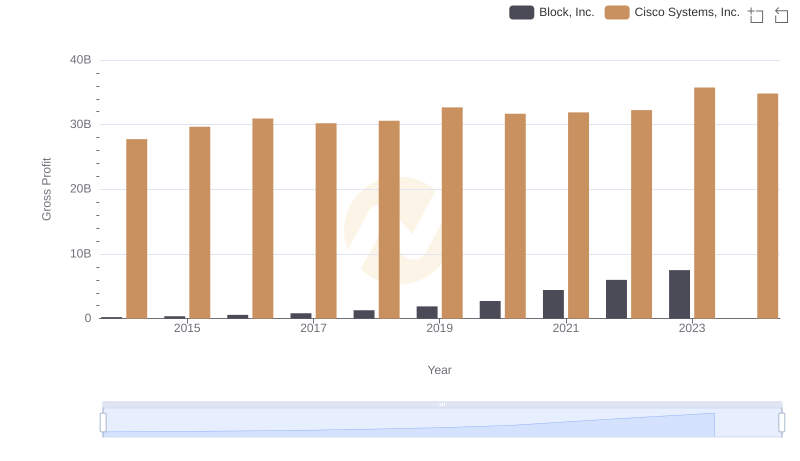
Gross Profit Comparison: Cisco Systems, Inc. and Block, Inc. Trends
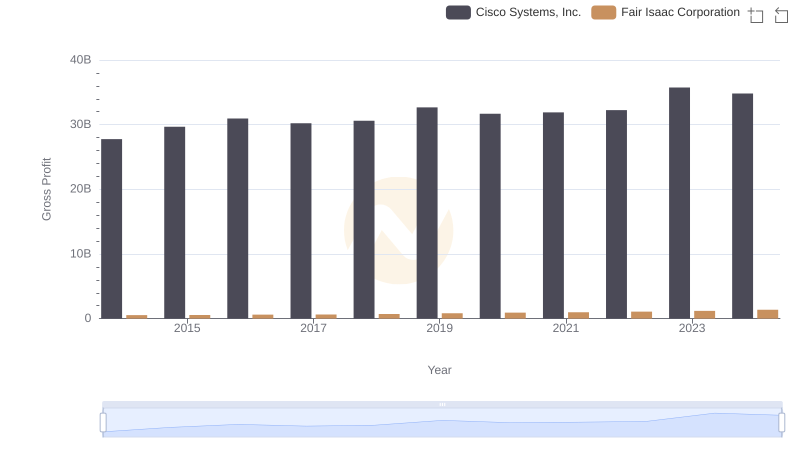
Cisco Systems, Inc. vs Fair Isaac Corporation: A Gross Profit Performance Breakdown
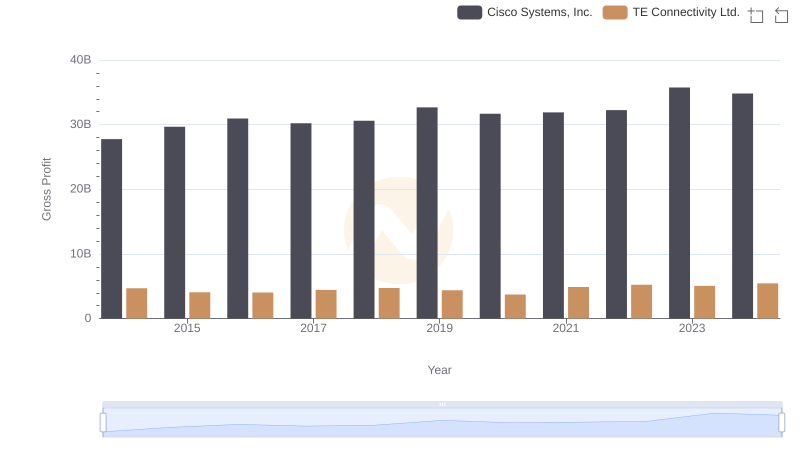
Who Generates Higher Gross Profit? Cisco Systems, Inc. or TE Connectivity Ltd.
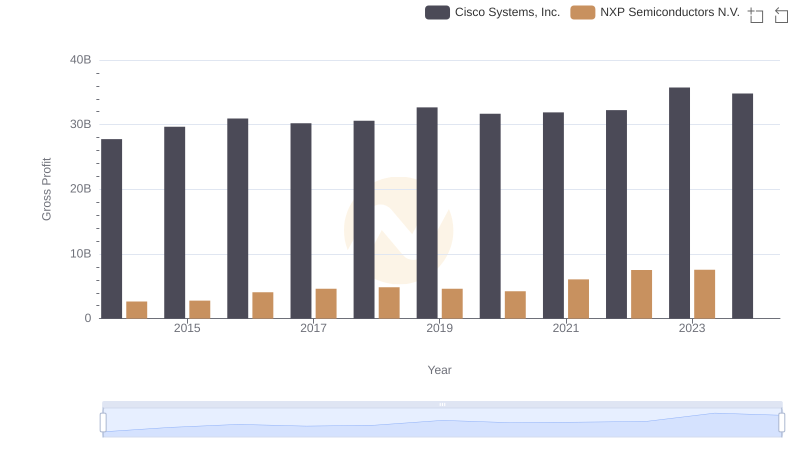
Key Insights on Gross Profit: Cisco Systems, Inc. vs NXP Semiconductors N.V.
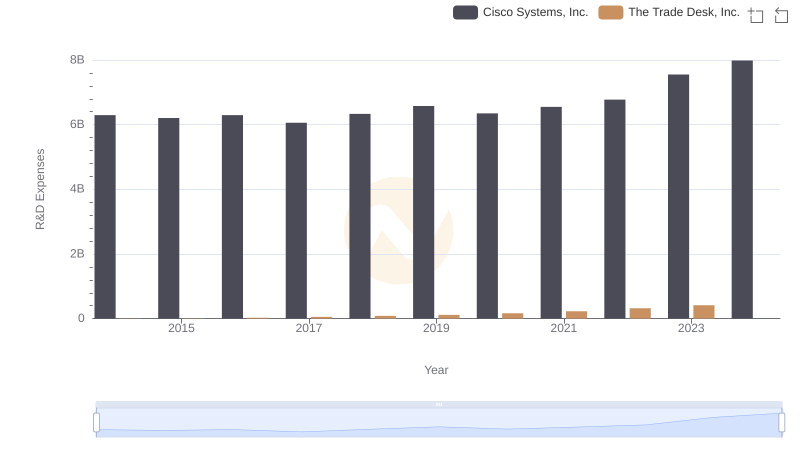
R&D Insights: How Cisco Systems, Inc. and The Trade Desk, Inc. Allocate Funds
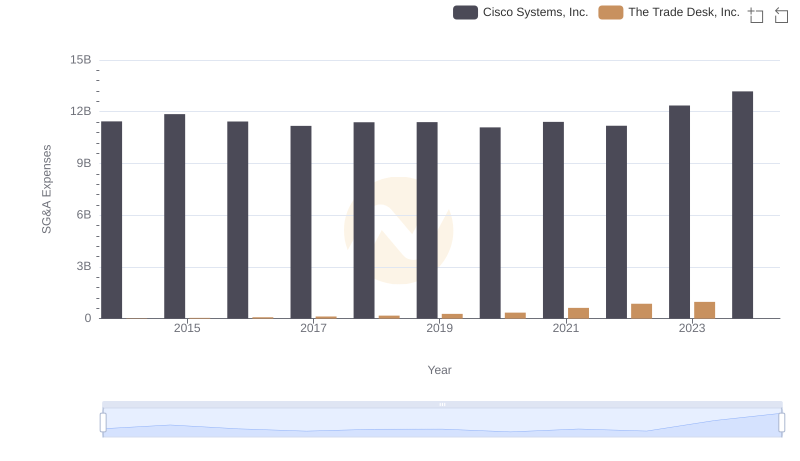
Cost Management Insights: SG&A Expenses for Cisco Systems, Inc. and The Trade Desk, Inc.
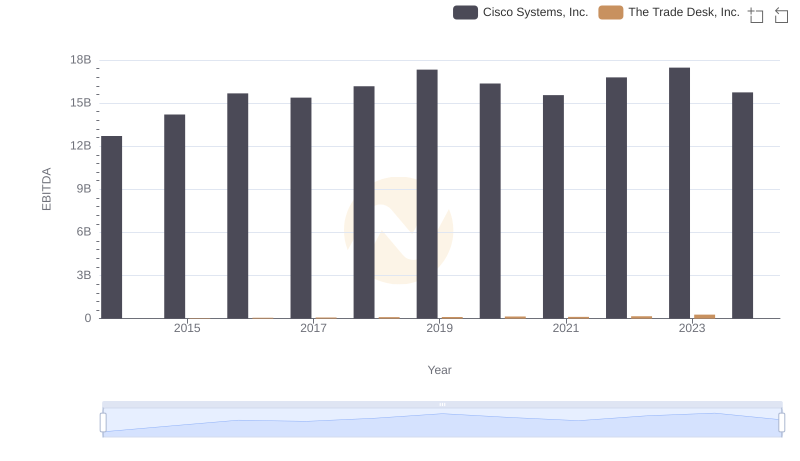
Professional EBITDA Benchmarking: Cisco Systems, Inc. vs The Trade Desk, Inc.