| __timestamp | Cisco Systems, Inc. | Ubiquiti Inc. |
|---|---|---|
| Wednesday, January 1, 2014 | 12709000000 | 198764000 |
| Thursday, January 1, 2015 | 14209000000 | 190986000 |
| Friday, January 1, 2016 | 15678000000 | 248349000 |
| Sunday, January 1, 2017 | 15383000000 | 289761000 |
| Monday, January 1, 2018 | 16172000000 | 333437000 |
| Tuesday, January 1, 2019 | 17334000000 | 401853000 |
| Wednesday, January 1, 2020 | 16363000000 | 485893000 |
| Friday, January 1, 2021 | 15558000000 | 742592000 |
| Saturday, January 1, 2022 | 16794000000 | 462264000 |
| Sunday, January 1, 2023 | 17471000000 | 560858000 |
| Monday, January 1, 2024 | 15747000000 | 518248000 |
Igniting the spark of knowledge
In the ever-evolving tech landscape, Cisco Systems, Inc. and Ubiquiti Inc. have carved distinct niches. From 2014 to 2024, Cisco's EBITDA consistently dwarfed Ubiquiti's, reflecting its robust market position. Cisco's EBITDA peaked in 2023, showcasing a 37% increase from 2014, while Ubiquiti's EBITDA saw a remarkable 181% growth over the same period, albeit from a smaller base.
Cisco's EBITDA remained above $15 billion annually, highlighting its stability and market leadership. The company's strategic acquisitions and innovations have fortified its financial health, making it a stalwart in the networking industry.
Ubiquiti, though smaller, demonstrated impressive growth, particularly in 2021, with a 52% surge in EBITDA compared to 2020. This growth underscores Ubiquiti's agility and its ability to capitalize on emerging market trends.
This comparison offers a compelling narrative of two tech giants navigating a decade of financial evolution.
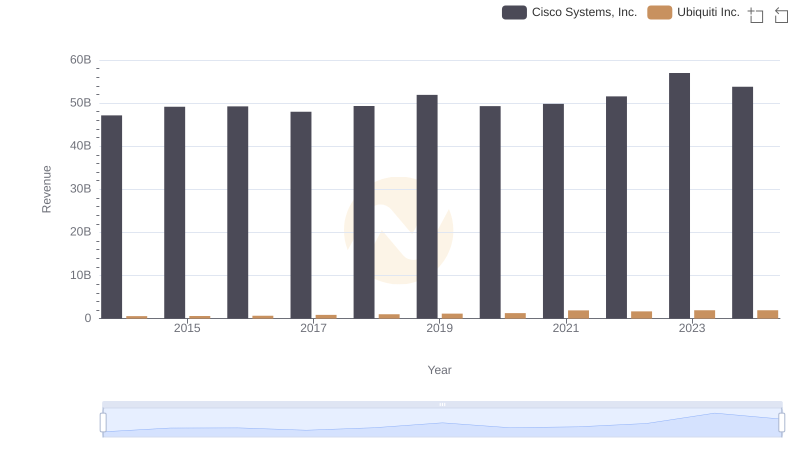
Revenue Insights: Cisco Systems, Inc. and Ubiquiti Inc. Performance Compared
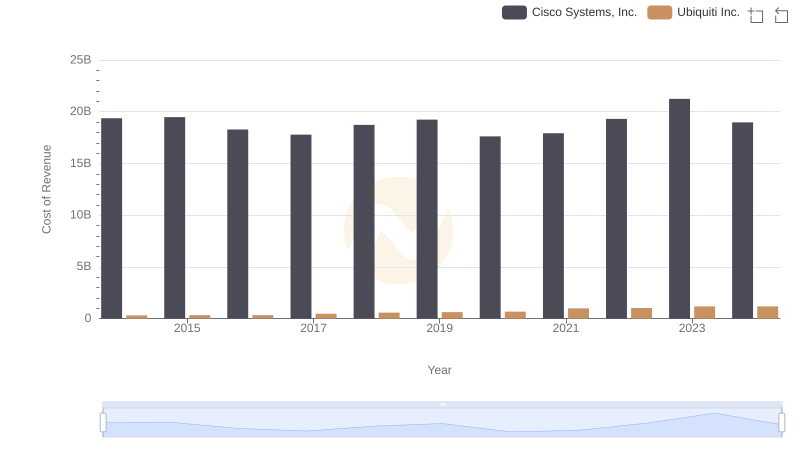
Cost of Revenue Trends: Cisco Systems, Inc. vs Ubiquiti Inc.
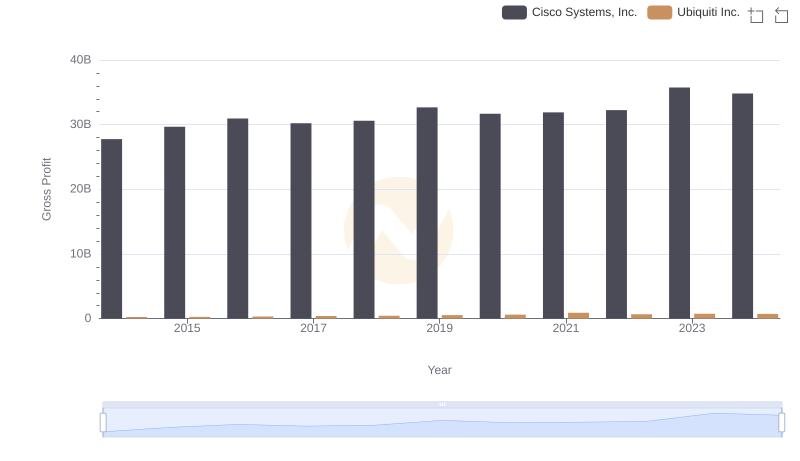
Cisco Systems, Inc. and Ubiquiti Inc.: A Detailed Gross Profit Analysis
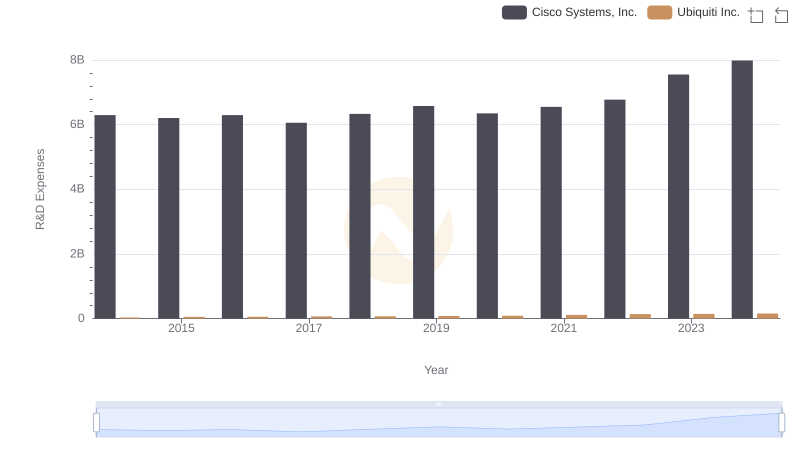
R&D Spending Showdown: Cisco Systems, Inc. vs Ubiquiti Inc.
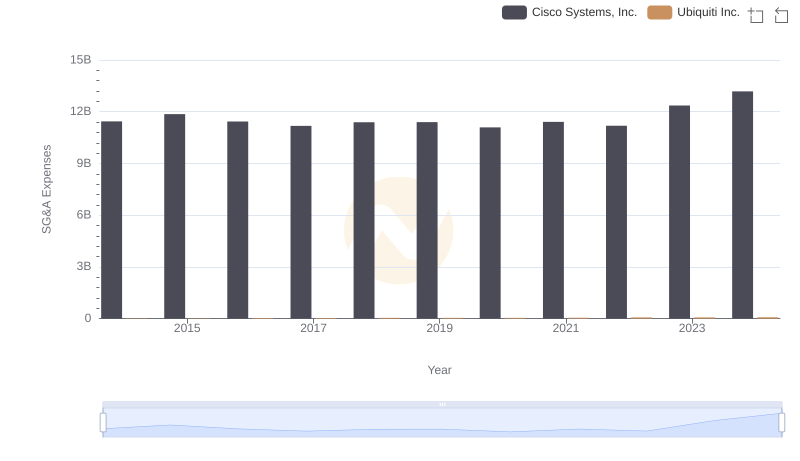
Cisco Systems, Inc. vs Ubiquiti Inc.: SG&A Expense Trends
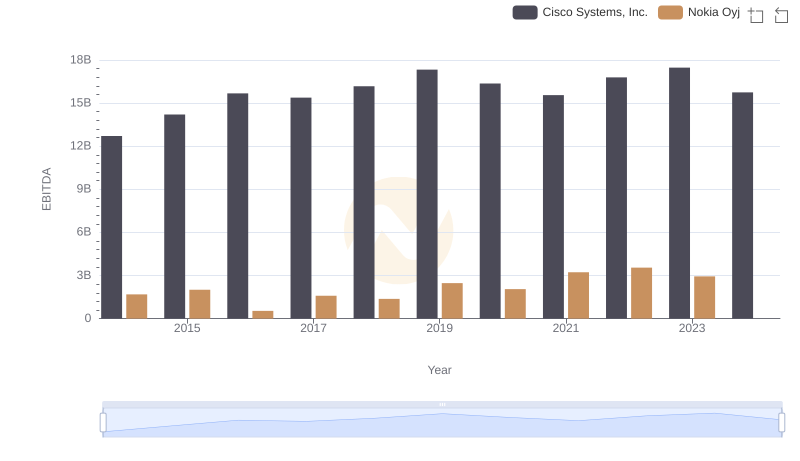
Professional EBITDA Benchmarking: Cisco Systems, Inc. vs Nokia Oyj
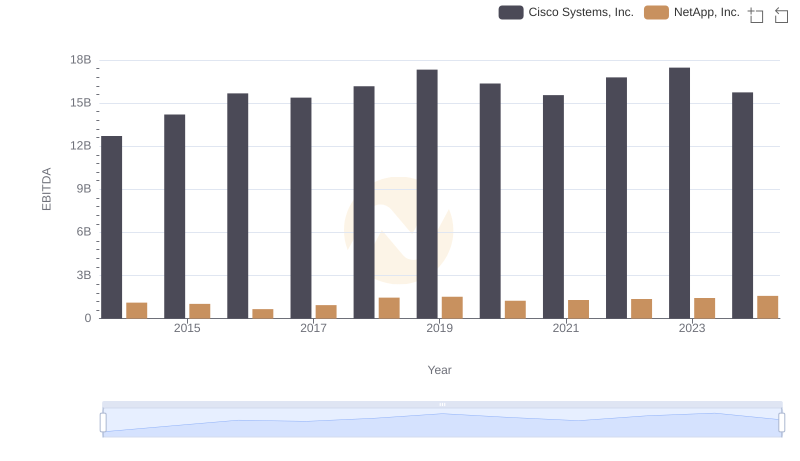
A Side-by-Side Analysis of EBITDA: Cisco Systems, Inc. and NetApp, Inc.
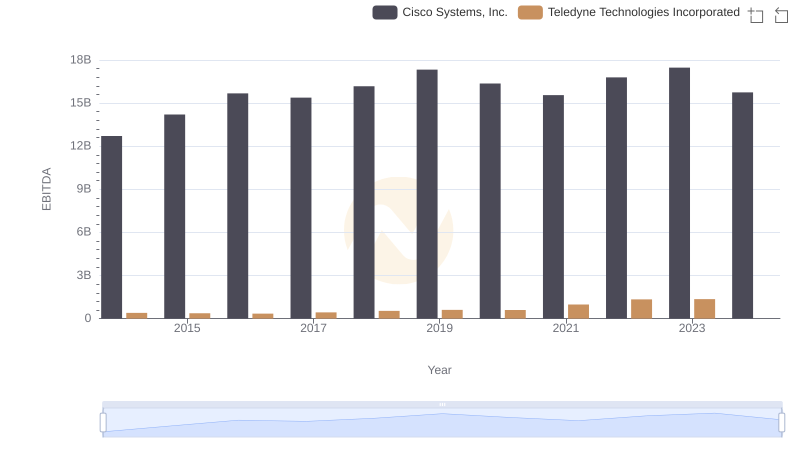
Cisco Systems, Inc. and Teledyne Technologies Incorporated: A Detailed Examination of EBITDA Performance

Professional EBITDA Benchmarking: Cisco Systems, Inc. vs ON Semiconductor Corporation
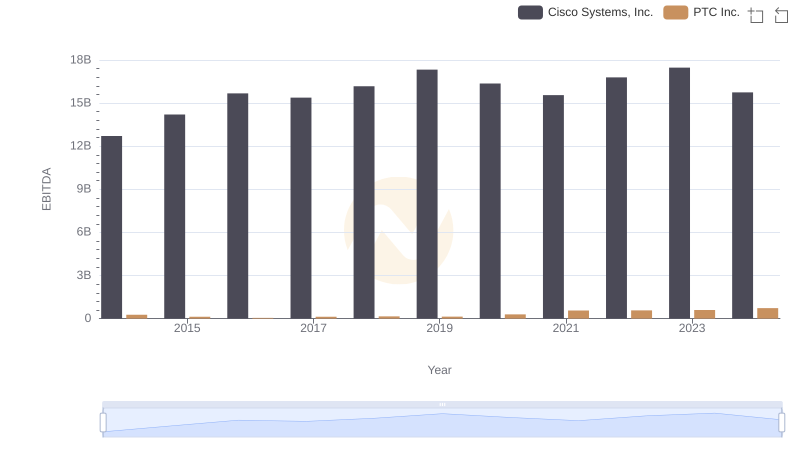
A Professional Review of EBITDA: Cisco Systems, Inc. Compared to PTC Inc.
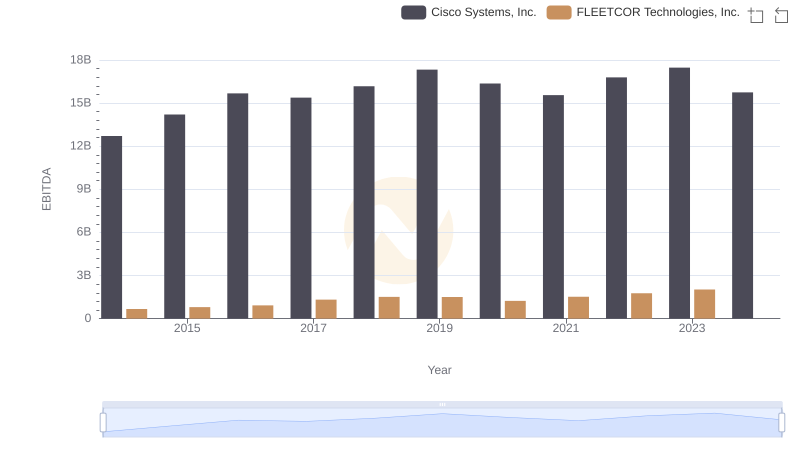
EBITDA Metrics Evaluated: Cisco Systems, Inc. vs FLEETCOR Technologies, Inc.
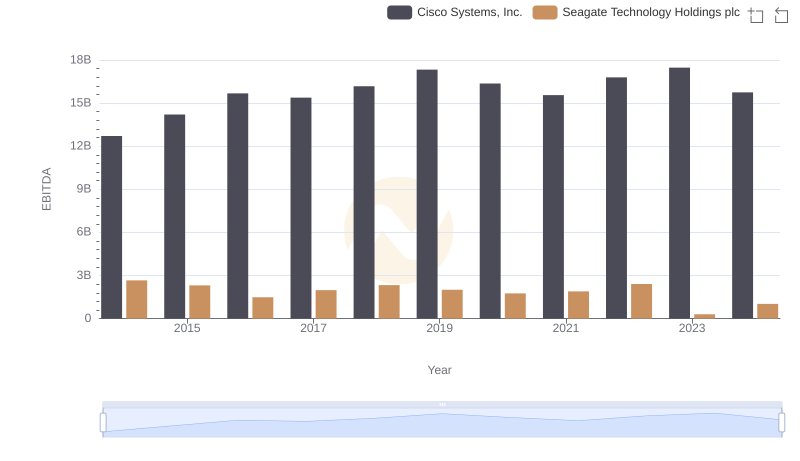
Cisco Systems, Inc. and Seagate Technology Holdings plc: A Detailed Examination of EBITDA Performance