| __timestamp | Cisco Systems, Inc. | HP Inc. |
|---|---|---|
| Wednesday, January 1, 2014 | 19373000000 | 84839000000 |
| Thursday, January 1, 2015 | 19480000000 | 41524000000 |
| Friday, January 1, 2016 | 18287000000 | 39240000000 |
| Sunday, January 1, 2017 | 17781000000 | 42478000000 |
| Monday, January 1, 2018 | 18724000000 | 47803000000 |
| Tuesday, January 1, 2019 | 19238000000 | 47586000000 |
| Wednesday, January 1, 2020 | 17618000000 | 46202000000 |
| Friday, January 1, 2021 | 17924000000 | 50070000000 |
| Saturday, January 1, 2022 | 19309000000 | 50648000000 |
| Sunday, January 1, 2023 | 21245000000 | 42210000000 |
| Monday, January 1, 2024 | 18975000000 | 41741000000 |
Igniting the spark of knowledge
In the ever-evolving tech industry, understanding the cost of revenue is crucial for evaluating a company's financial health. Cisco Systems, Inc. and HP Inc., two giants in the sector, have shown intriguing trends over the past decade. From 2014 to 2023, Cisco's cost of revenue fluctuated modestly, peaking in 2023 with a 10% increase from its 2014 figures. In contrast, HP Inc. experienced a more volatile journey, with a significant drop of nearly 50% from 2014 to 2015, followed by a steady climb, reaching a high in 2022. These trends reflect the companies' strategic shifts and market dynamics. Cisco's consistent cost management contrasts with HP's adaptive strategies in response to market demands. As we look to 2024, these insights offer a window into the operational efficiencies and challenges faced by these tech titans.
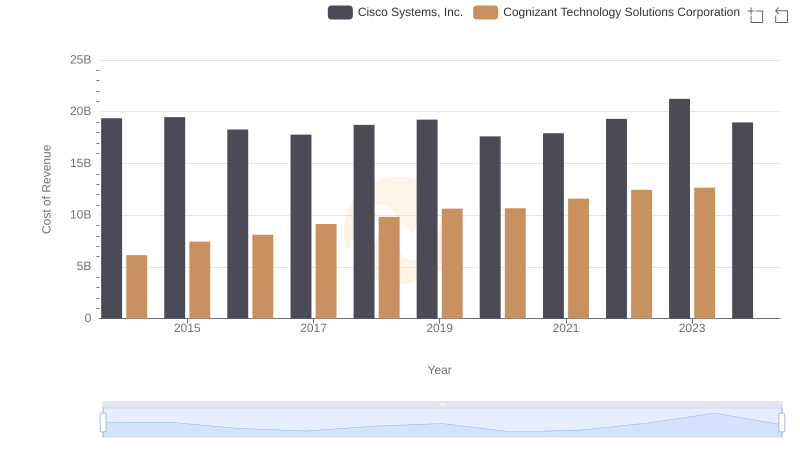
Analyzing Cost of Revenue: Cisco Systems, Inc. and Cognizant Technology Solutions Corporation
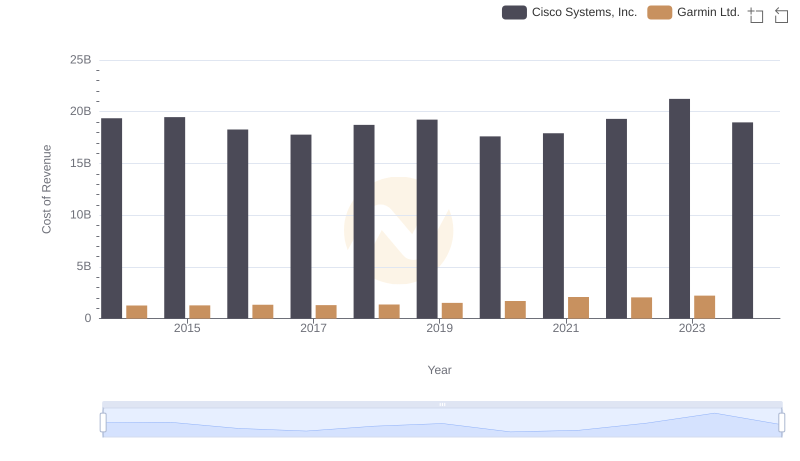
Cost of Revenue Trends: Cisco Systems, Inc. vs Garmin Ltd.
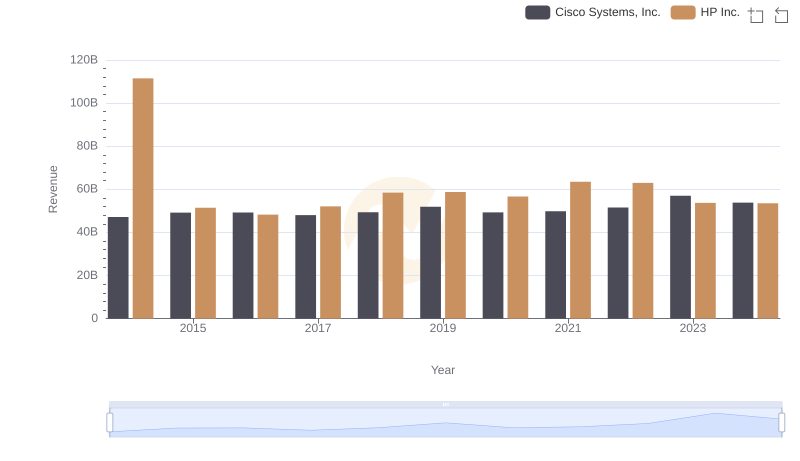
Cisco Systems, Inc. and HP Inc.: A Comprehensive Revenue Analysis
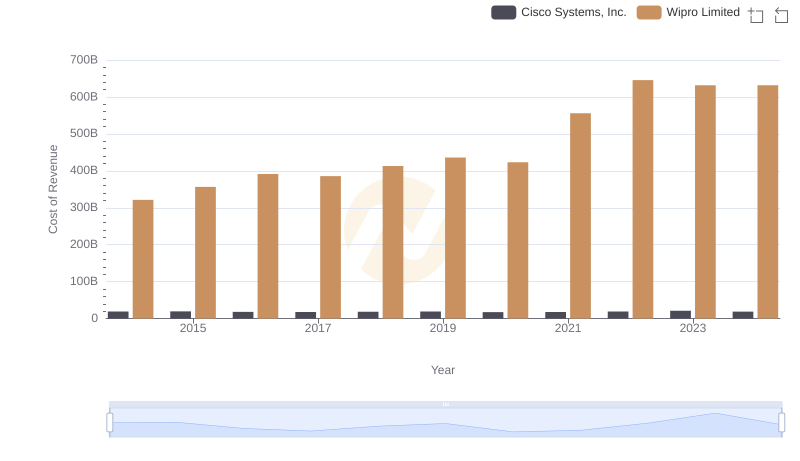
Cost of Revenue Trends: Cisco Systems, Inc. vs Wipro Limited
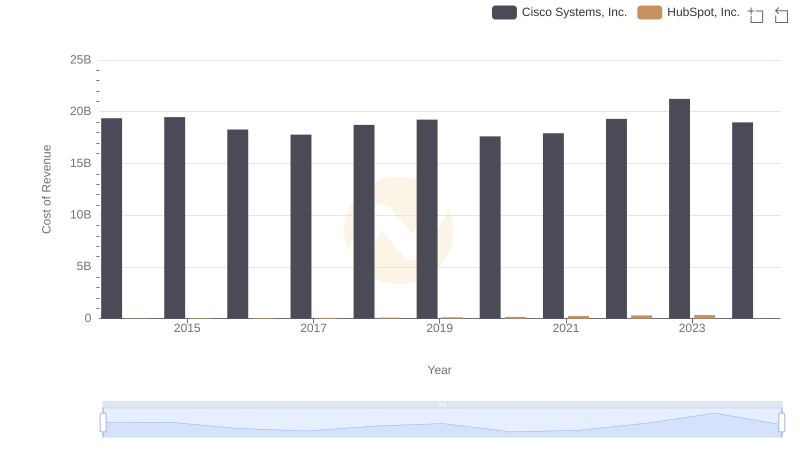
Cisco Systems, Inc. vs HubSpot, Inc.: Efficiency in Cost of Revenue Explored
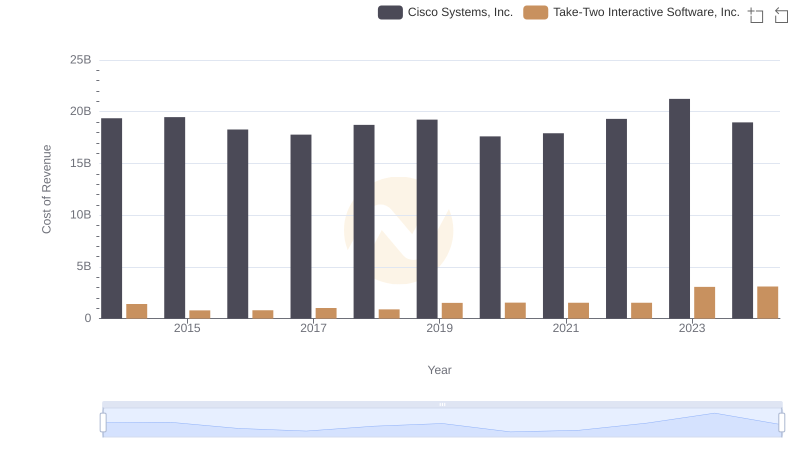
Cisco Systems, Inc. vs Take-Two Interactive Software, Inc.: Efficiency in Cost of Revenue Explored
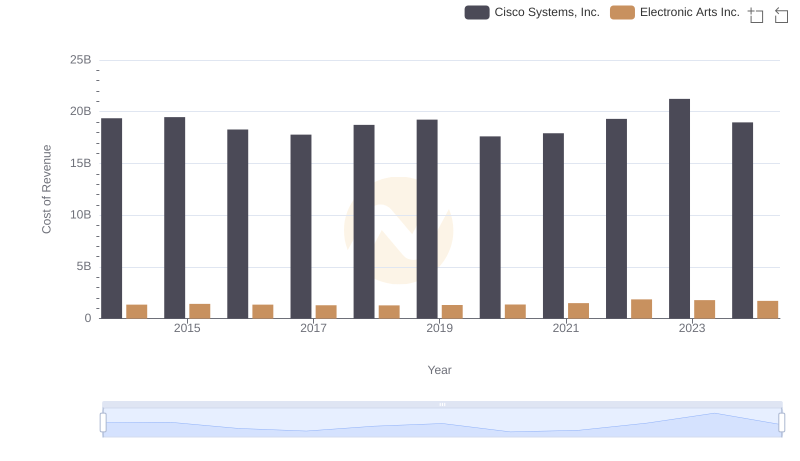
Cost of Revenue: Key Insights for Cisco Systems, Inc. and Electronic Arts Inc.

Gross Profit Analysis: Comparing Cisco Systems, Inc. and HP Inc.

Analyzing Cost of Revenue: Cisco Systems, Inc. and Microchip Technology Incorporated
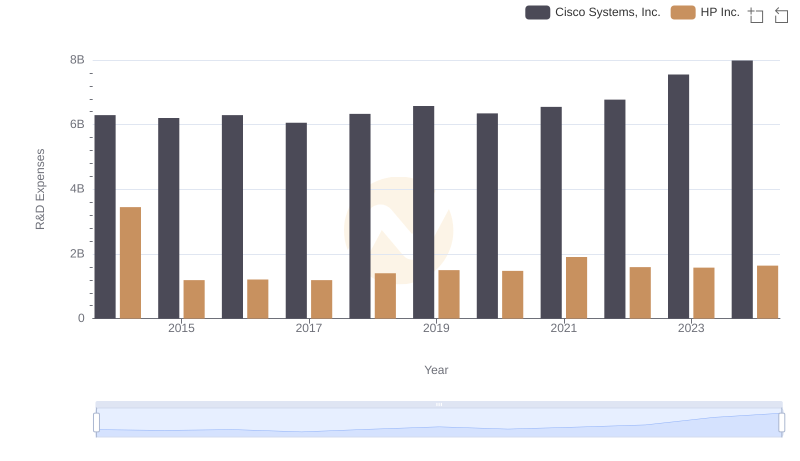
Who Prioritizes Innovation? R&D Spending Compared for Cisco Systems, Inc. and HP Inc.
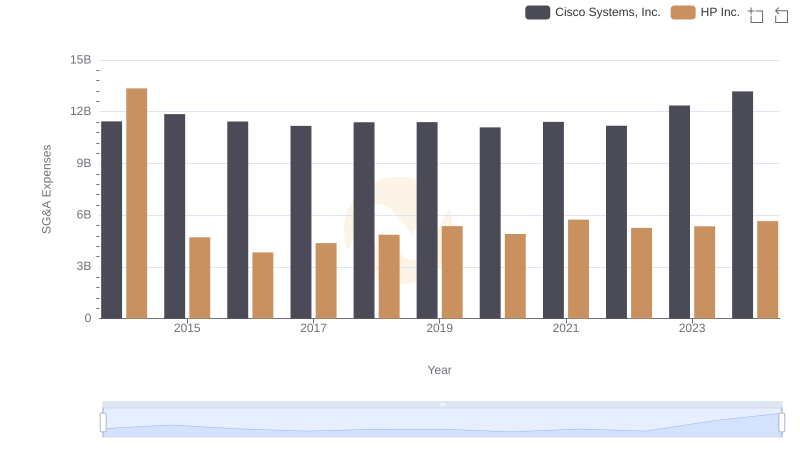
Breaking Down SG&A Expenses: Cisco Systems, Inc. vs HP Inc.
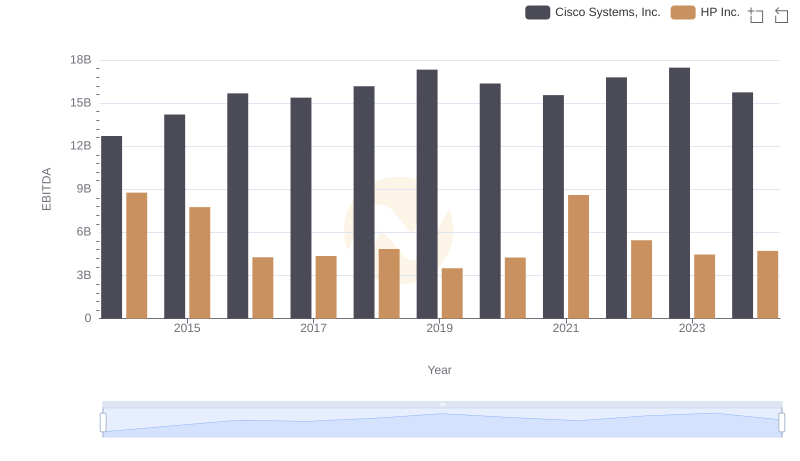
Professional EBITDA Benchmarking: Cisco Systems, Inc. vs HP Inc.