| __timestamp | Cisco Systems, Inc. | Wipro Limited |
|---|---|---|
| Wednesday, January 1, 2014 | 12709000000 | 128105000000 |
| Thursday, January 1, 2015 | 14209000000 | 107958000000 |
| Friday, January 1, 2016 | 15678000000 | 133082000000 |
| Sunday, January 1, 2017 | 15383000000 | 126406000000 |
| Monday, January 1, 2018 | 16172000000 | 114648000000 |
| Tuesday, January 1, 2019 | 17334000000 | 122279000000 |
| Wednesday, January 1, 2020 | 16363000000 | 168413000000 |
| Friday, January 1, 2021 | 15558000000 | 165303000000 |
| Saturday, January 1, 2022 | 16794000000 | 189377000000 |
| Sunday, January 1, 2023 | 17471000000 | 193833000000 |
| Monday, January 1, 2024 | 15747000000 | 193833000000 |
In pursuit of knowledge
In the ever-evolving landscape of global technology, Cisco Systems, Inc. and Wipro Limited stand as titans, each showcasing unique financial trajectories. From 2014 to 2023, Cisco's EBITDA grew by approximately 37%, peaking in 2023, while Wipro's EBITDA surged by nearly 51% over the same period. This growth highlights Wipro's robust expansion strategy, particularly in the latter half of the decade. Notably, Cisco's EBITDA remained relatively stable, with a slight dip in 2024, reflecting potential market adjustments or strategic shifts. The data underscores the resilience and adaptability of these companies amidst global economic fluctuations. As we delve deeper into these figures, it becomes evident that while both companies are leaders in their domains, their financial strategies and market responses differ significantly, offering valuable insights into their operational philosophies.
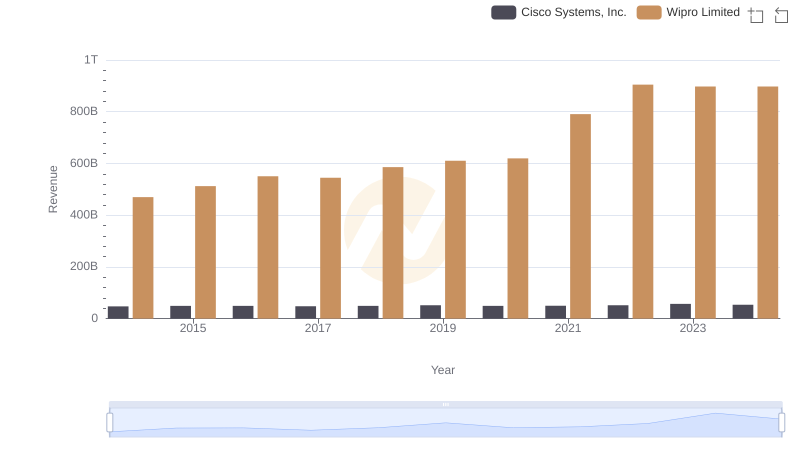
Revenue Insights: Cisco Systems, Inc. and Wipro Limited Performance Compared
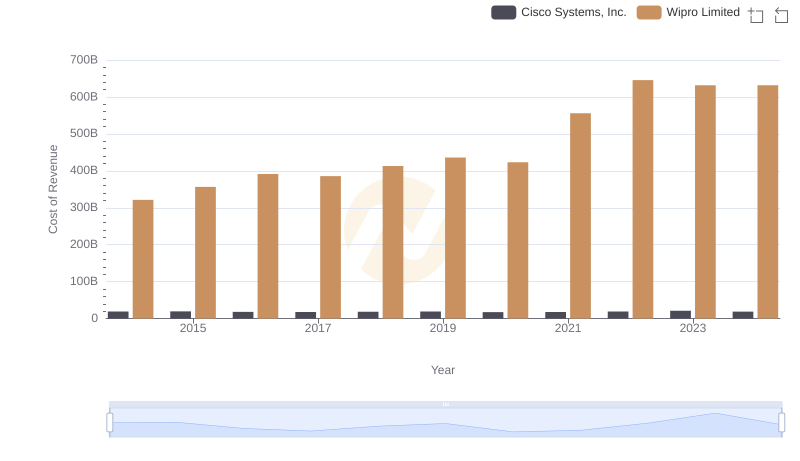
Cost of Revenue Trends: Cisco Systems, Inc. vs Wipro Limited
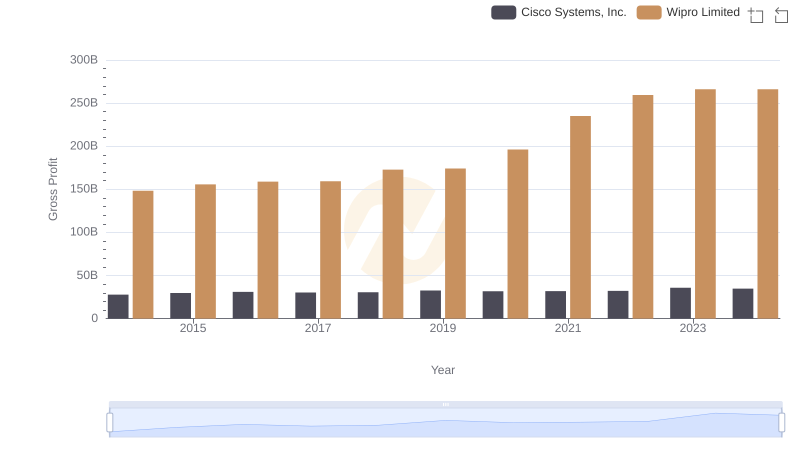
Gross Profit Analysis: Comparing Cisco Systems, Inc. and Wipro Limited
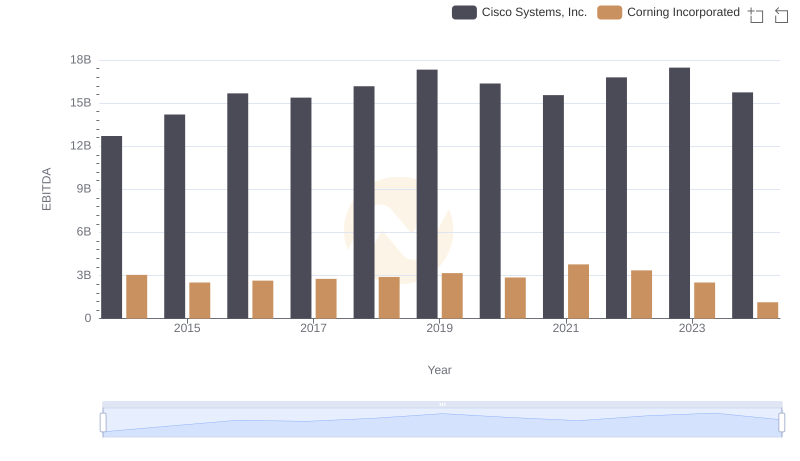
Cisco Systems, Inc. vs Corning Incorporated: In-Depth EBITDA Performance Comparison
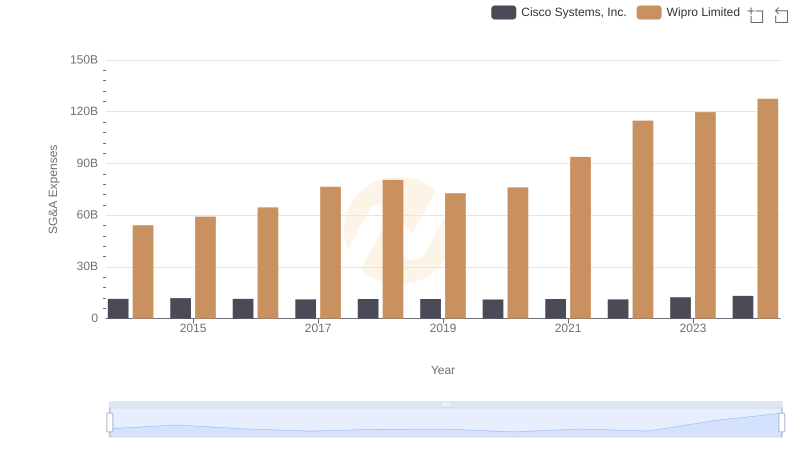
Breaking Down SG&A Expenses: Cisco Systems, Inc. vs Wipro Limited
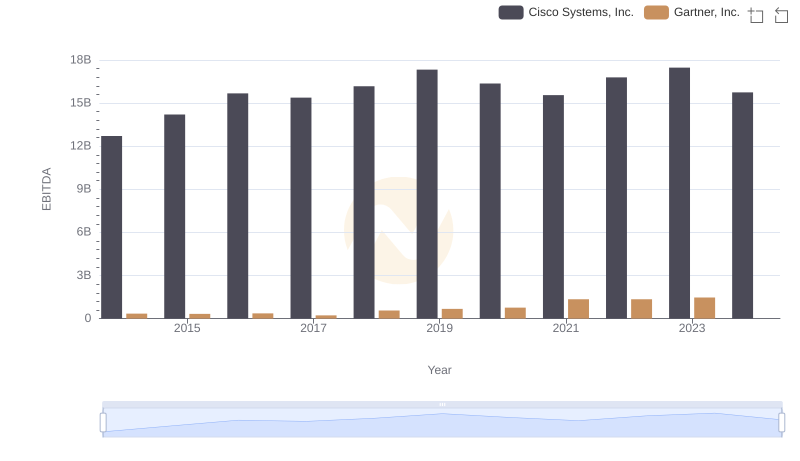
EBITDA Performance Review: Cisco Systems, Inc. vs Gartner, Inc.

Cisco Systems, Inc. vs Cognizant Technology Solutions Corporation: In-Depth EBITDA Performance Comparison
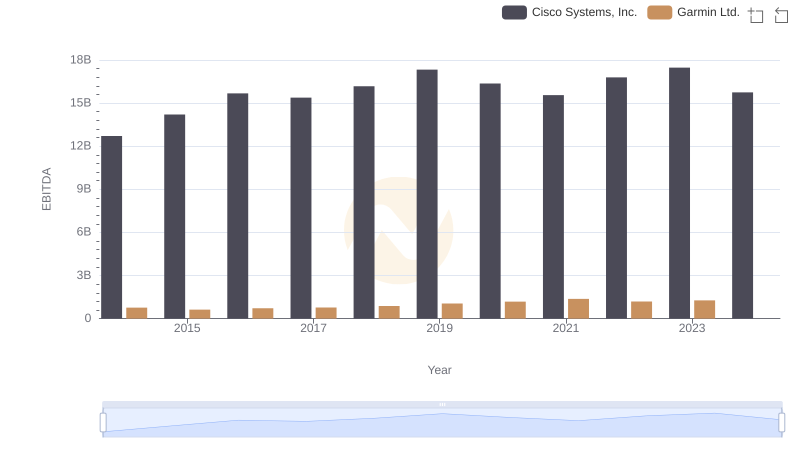
A Side-by-Side Analysis of EBITDA: Cisco Systems, Inc. and Garmin Ltd.
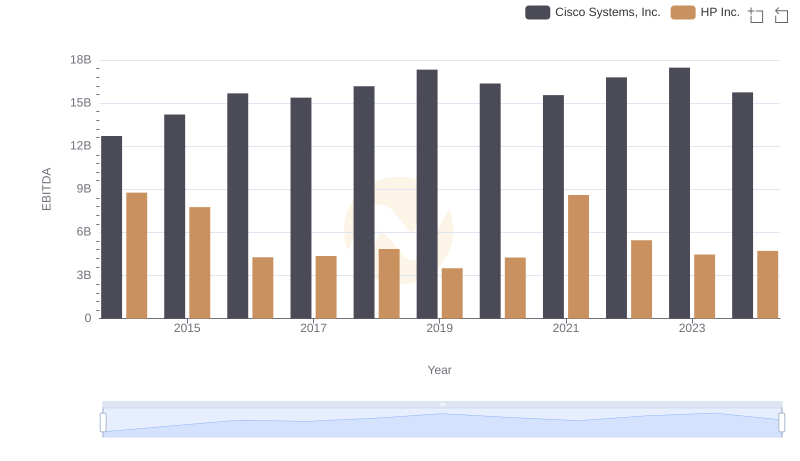
Professional EBITDA Benchmarking: Cisco Systems, Inc. vs HP Inc.
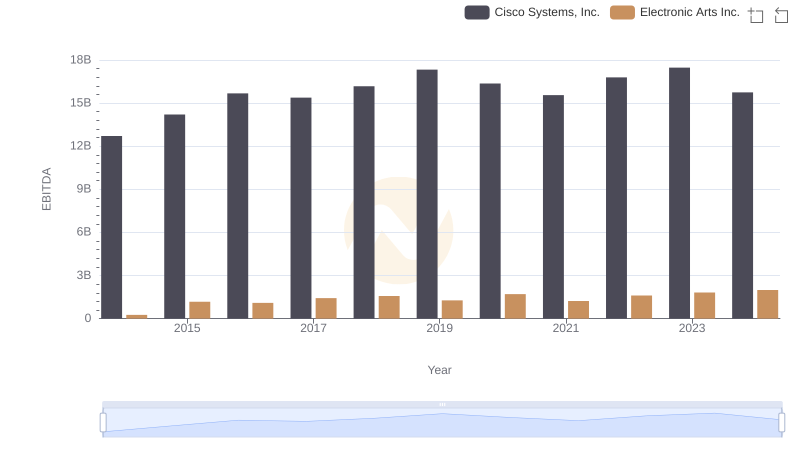
Professional EBITDA Benchmarking: Cisco Systems, Inc. vs Electronic Arts Inc.

EBITDA Metrics Evaluated: Cisco Systems, Inc. vs Corpay, Inc.
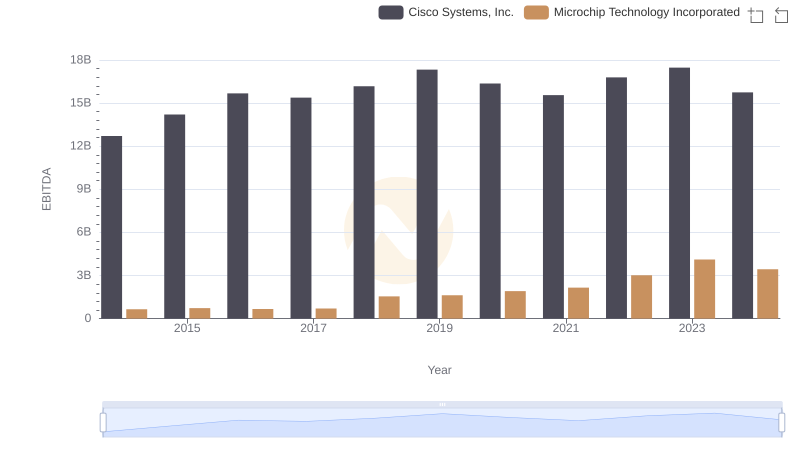
A Side-by-Side Analysis of EBITDA: Cisco Systems, Inc. and Microchip Technology Incorporated