| __timestamp | Cisco Systems, Inc. | HP Inc. |
|---|---|---|
| Wednesday, January 1, 2014 | 47142000000 | 111454000000 |
| Thursday, January 1, 2015 | 49161000000 | 51463000000 |
| Friday, January 1, 2016 | 49247000000 | 48238000000 |
| Sunday, January 1, 2017 | 48005000000 | 52056000000 |
| Monday, January 1, 2018 | 49330000000 | 58472000000 |
| Tuesday, January 1, 2019 | 51904000000 | 58756000000 |
| Wednesday, January 1, 2020 | 49301000000 | 56639000000 |
| Friday, January 1, 2021 | 49818000000 | 63487000000 |
| Saturday, January 1, 2022 | 51557000000 | 62983000000 |
| Sunday, January 1, 2023 | 56998000000 | 53718000000 |
| Monday, January 1, 2024 | 53803000000 | 53559000000 |
Unleashing the power of data
In the ever-evolving tech landscape, Cisco Systems, Inc. and HP Inc. have been pivotal players. From 2014 to 2024, these giants have showcased intriguing revenue trends. Cisco's revenue journey began with a modest 47 billion in 2014, peaking at approximately 57 billion in 2023, marking a growth of around 21%. Meanwhile, HP Inc. started with a staggering 111 billion in 2014, but experienced a decline, settling at about 54 billion in 2024, a drop of over 50%.
This analysis highlights Cisco's steady growth trajectory, contrasting with HP's fluctuating fortunes. The data underscores the resilience of Cisco in maintaining a consistent upward trend, while HP's revenue reflects a more volatile path. As we look to the future, these insights provide a window into the strategic maneuvers of these tech titans.
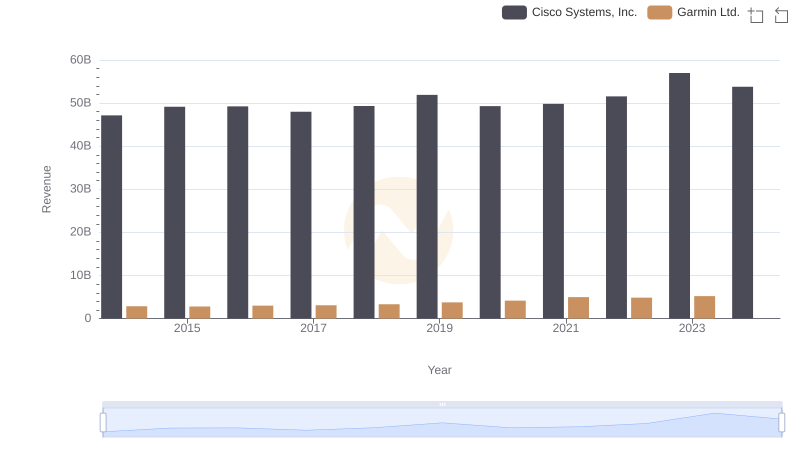
Comparing Revenue Performance: Cisco Systems, Inc. or Garmin Ltd.?
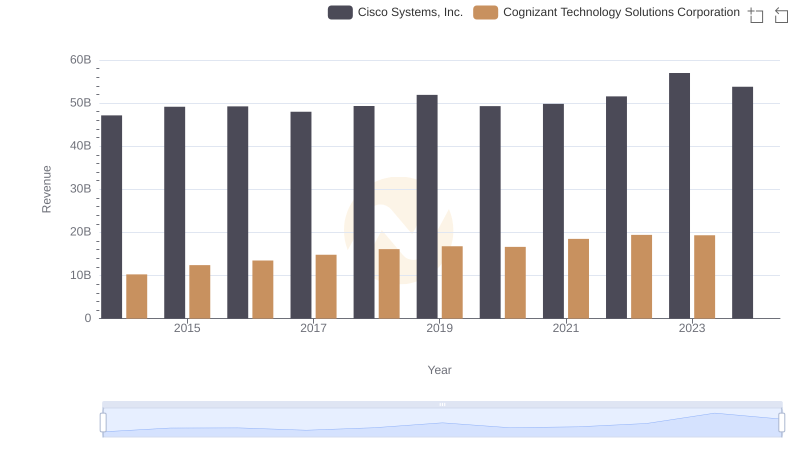
Cisco Systems, Inc. vs Cognizant Technology Solutions Corporation: Annual Revenue Growth Compared
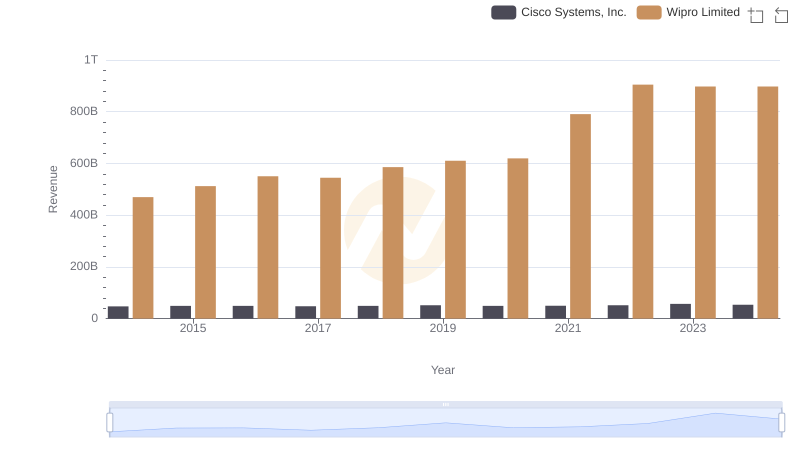
Revenue Insights: Cisco Systems, Inc. and Wipro Limited Performance Compared
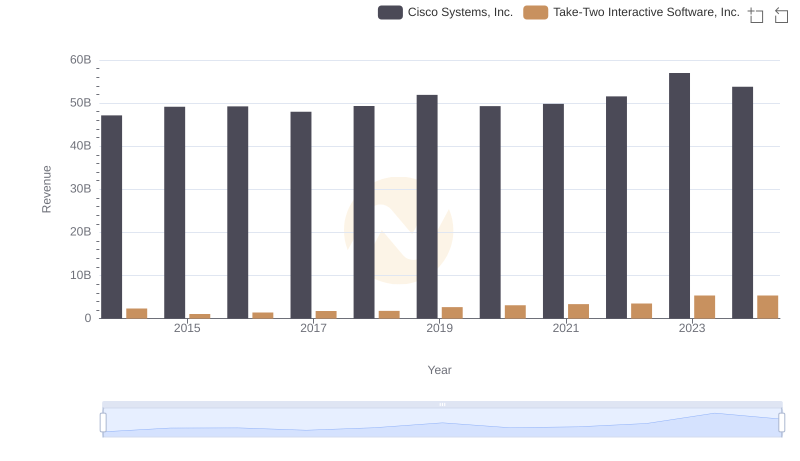
Annual Revenue Comparison: Cisco Systems, Inc. vs Take-Two Interactive Software, Inc.

Cisco Systems, Inc. or HubSpot, Inc.: Who Leads in Yearly Revenue?
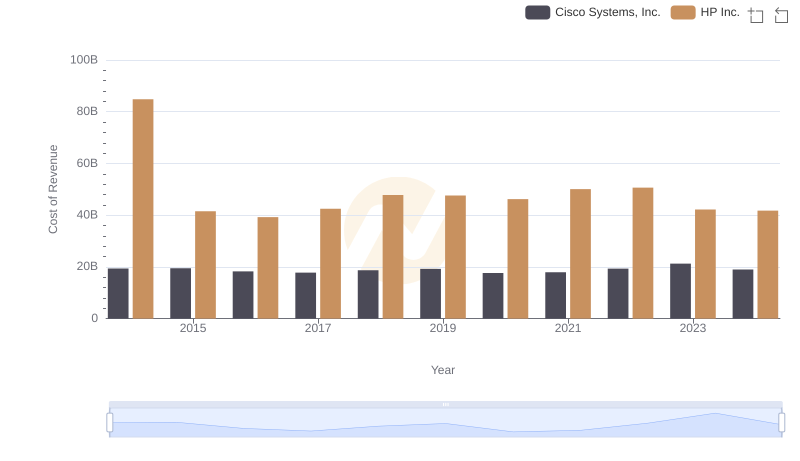
Cost of Revenue: Key Insights for Cisco Systems, Inc. and HP Inc.
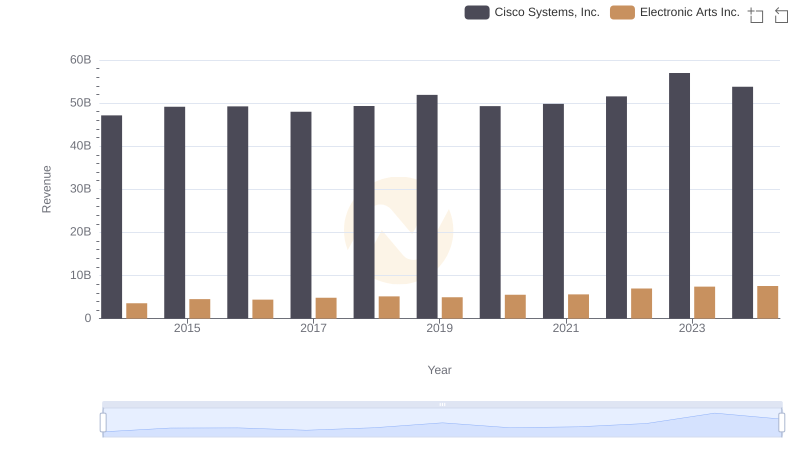
Cisco Systems, Inc. or Electronic Arts Inc.: Who Leads in Yearly Revenue?
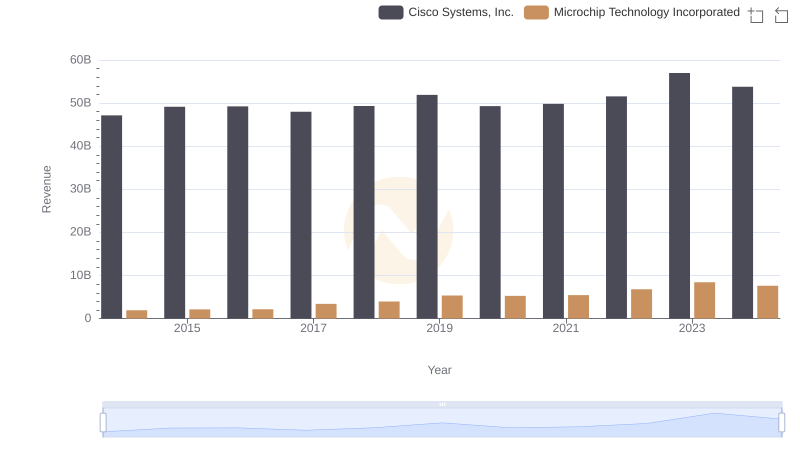
Breaking Down Revenue Trends: Cisco Systems, Inc. vs Microchip Technology Incorporated

Gross Profit Analysis: Comparing Cisco Systems, Inc. and HP Inc.
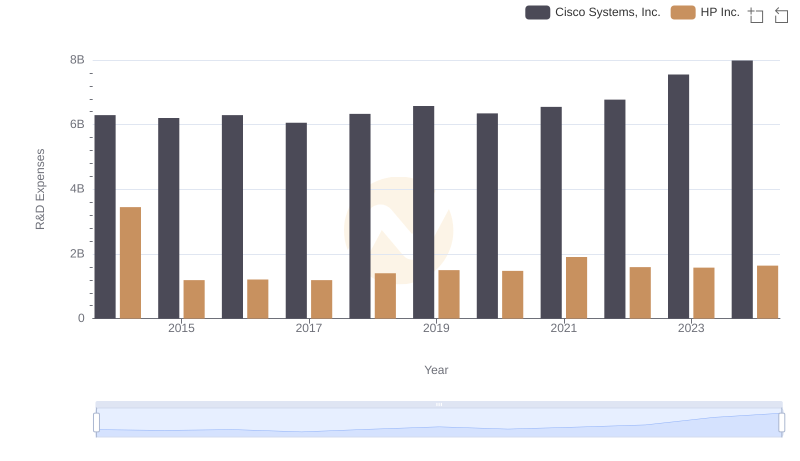
Who Prioritizes Innovation? R&D Spending Compared for Cisco Systems, Inc. and HP Inc.
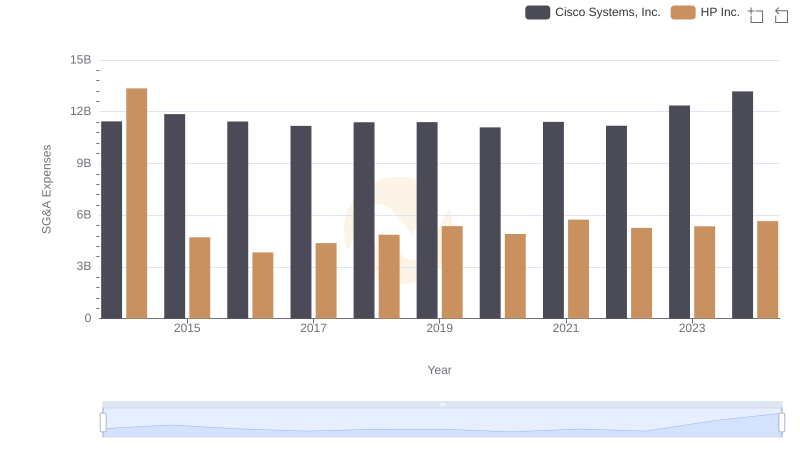
Breaking Down SG&A Expenses: Cisco Systems, Inc. vs HP Inc.
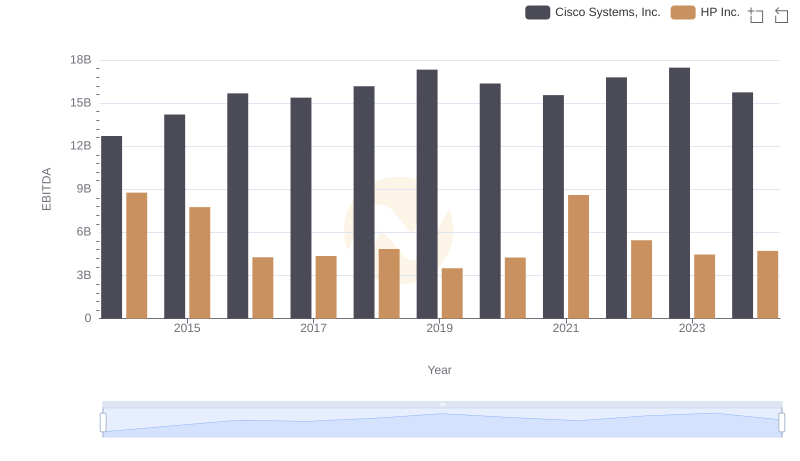
Professional EBITDA Benchmarking: Cisco Systems, Inc. vs HP Inc.