| __timestamp | Cisco Systems, Inc. | Garmin Ltd. |
|---|---|---|
| Wednesday, January 1, 2014 | 12709000000 | 767641000 |
| Thursday, January 1, 2015 | 14209000000 | 627941000 |
| Friday, January 1, 2016 | 15678000000 | 719204000 |
| Sunday, January 1, 2017 | 15383000000 | 769889000 |
| Monday, January 1, 2018 | 16172000000 | 874537000 |
| Tuesday, January 1, 2019 | 17334000000 | 1051761000 |
| Wednesday, January 1, 2020 | 16363000000 | 1180955000 |
| Friday, January 1, 2021 | 15558000000 | 1373438000 |
| Saturday, January 1, 2022 | 16794000000 | 1191698000 |
| Sunday, January 1, 2023 | 17471000000 | 1269732000 |
| Monday, January 1, 2024 | 15747000000 | 1593994000 |
Unlocking the unknown
In the ever-evolving tech landscape, Cisco Systems, Inc. and Garmin Ltd. have carved distinct niches. From 2014 to 2023, Cisco's EBITDA consistently outpaced Garmin's, showcasing its robust market position. Cisco's EBITDA grew by approximately 37% over this period, peaking in 2023. In contrast, Garmin's EBITDA, while smaller, demonstrated a steady upward trajectory, increasing by about 65% from 2014 to 2023. Notably, Garmin's EBITDA reached its zenith in 2021, marking a significant milestone. However, data for 2024 remains elusive, leaving room for speculation. This financial snapshot underscores Cisco's dominance in the tech sector, while Garmin's growth highlights its resilience and adaptability. As the tech industry continues to evolve, these insights offer a glimpse into the strategic maneuvers of two industry giants.
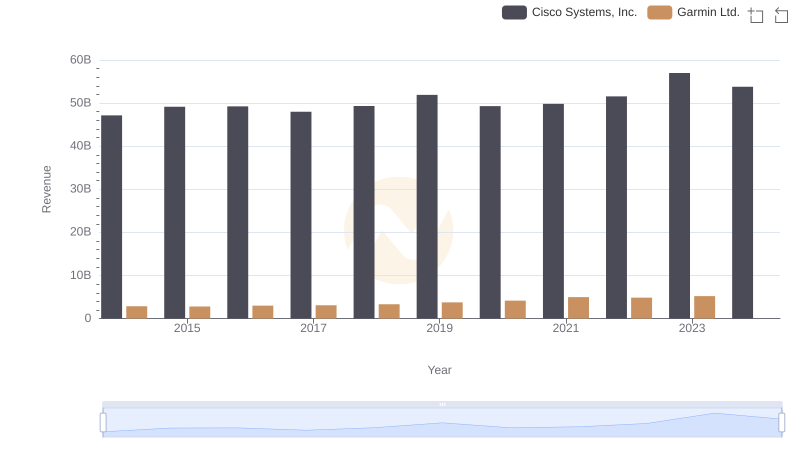
Comparing Revenue Performance: Cisco Systems, Inc. or Garmin Ltd.?
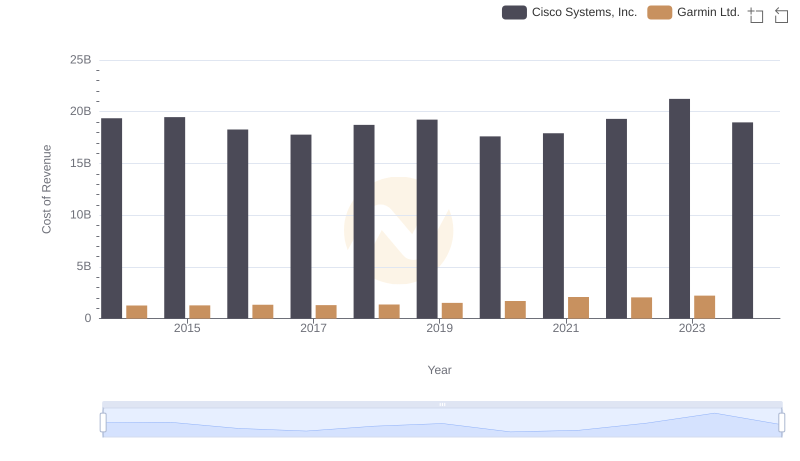
Cost of Revenue Trends: Cisco Systems, Inc. vs Garmin Ltd.

Gross Profit Trends Compared: Cisco Systems, Inc. vs Garmin Ltd.
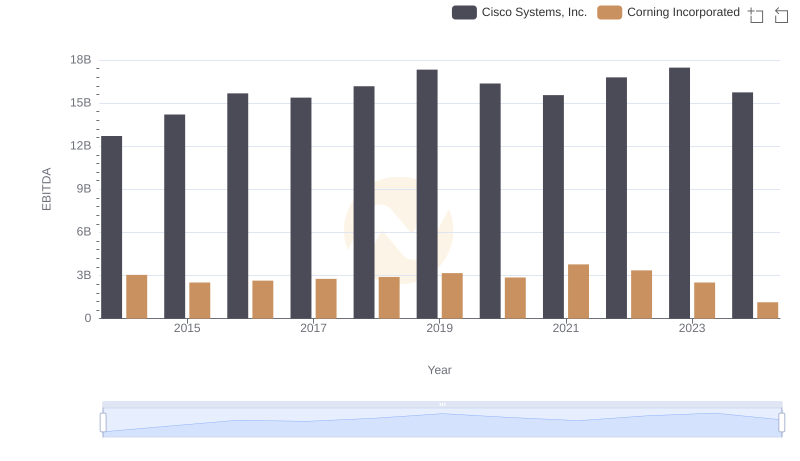
Cisco Systems, Inc. vs Corning Incorporated: In-Depth EBITDA Performance Comparison
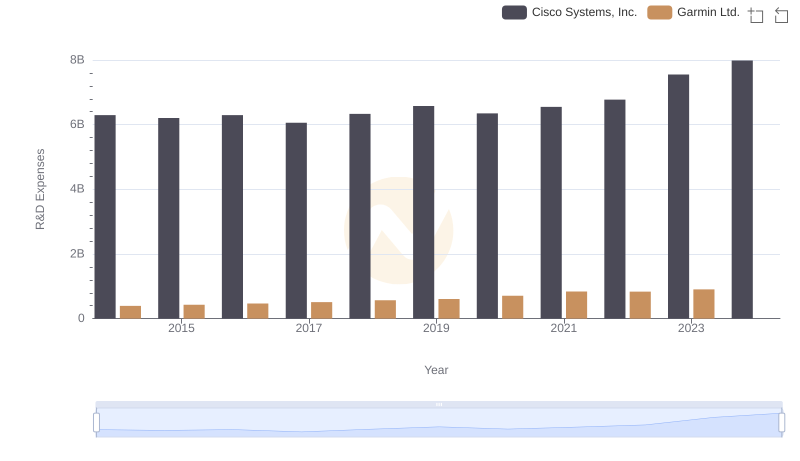
Analyzing R&D Budgets: Cisco Systems, Inc. vs Garmin Ltd.
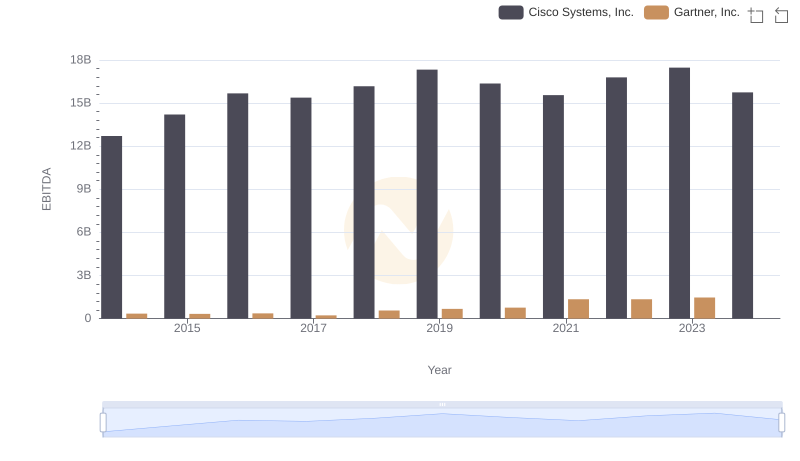
EBITDA Performance Review: Cisco Systems, Inc. vs Gartner, Inc.

Cisco Systems, Inc. vs Cognizant Technology Solutions Corporation: In-Depth EBITDA Performance Comparison

Cost Management Insights: SG&A Expenses for Cisco Systems, Inc. and Garmin Ltd.

Cisco Systems, Inc. and Wipro Limited: A Detailed Examination of EBITDA Performance
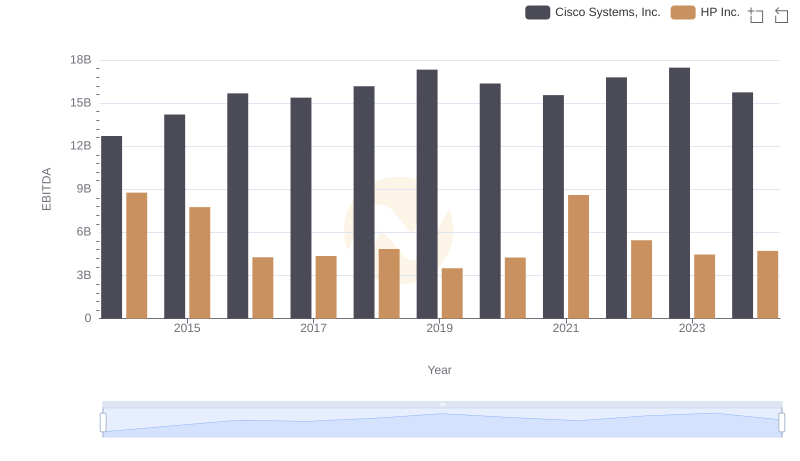
Professional EBITDA Benchmarking: Cisco Systems, Inc. vs HP Inc.
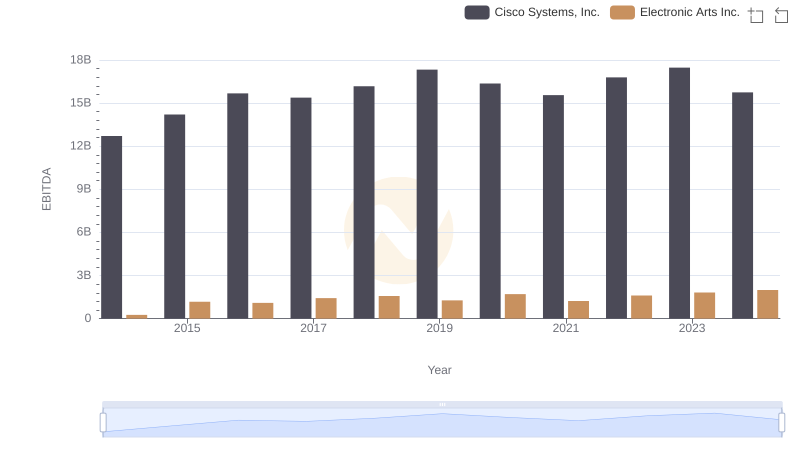
Professional EBITDA Benchmarking: Cisco Systems, Inc. vs Electronic Arts Inc.
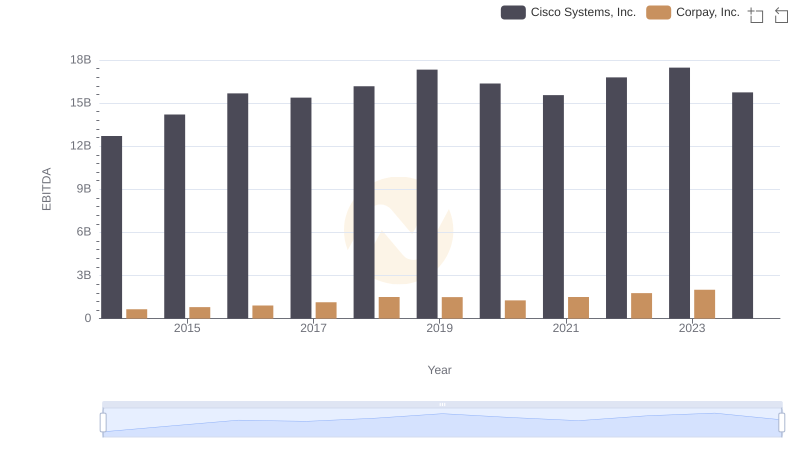
EBITDA Metrics Evaluated: Cisco Systems, Inc. vs Corpay, Inc.