| __timestamp | Cisco Systems, Inc. | Dell Technologies Inc. |
|---|---|---|
| Wednesday, January 1, 2014 | 12709000000 | 1108000000 |
| Thursday, January 1, 2015 | 14209000000 | 2569000000 |
| Friday, January 1, 2016 | 15678000000 | 2266000000 |
| Sunday, January 1, 2017 | 15383000000 | 2591000000 |
| Monday, January 1, 2018 | 16172000000 | 6271000000 |
| Tuesday, January 1, 2019 | 17334000000 | 7873000000 |
| Wednesday, January 1, 2020 | 16363000000 | 8814000000 |
| Friday, January 1, 2021 | 15558000000 | 9925000000 |
| Saturday, January 1, 2022 | 16794000000 | 12016000000 |
| Sunday, January 1, 2023 | 17471000000 | 7603000000 |
| Monday, January 1, 2024 | 15747000000 | 8746000000 |
Unleashing the power of data
In the ever-evolving tech industry, Cisco Systems, Inc. and Dell Technologies Inc. have been pivotal players. Over the past decade, Cisco has consistently outperformed Dell in terms of EBITDA, showcasing its robust financial health. From 2014 to 2023, Cisco's EBITDA grew by approximately 37%, peaking in 2023. In contrast, Dell's EBITDA saw a more volatile trajectory, with a notable surge of over 980% from 2014 to 2022, before a dip in 2023. This fluctuation highlights Dell's dynamic market strategies and adaptability. The data underscores Cisco's steady growth and Dell's aggressive expansion, offering valuable insights for investors and industry analysts. As we look to the future, these trends provide a compelling narrative of resilience and innovation in the tech sector.
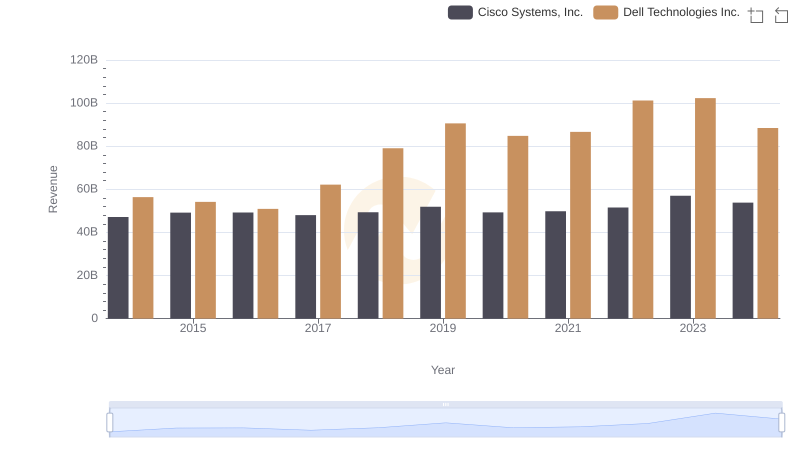
Who Generates More Revenue? Cisco Systems, Inc. or Dell Technologies Inc.
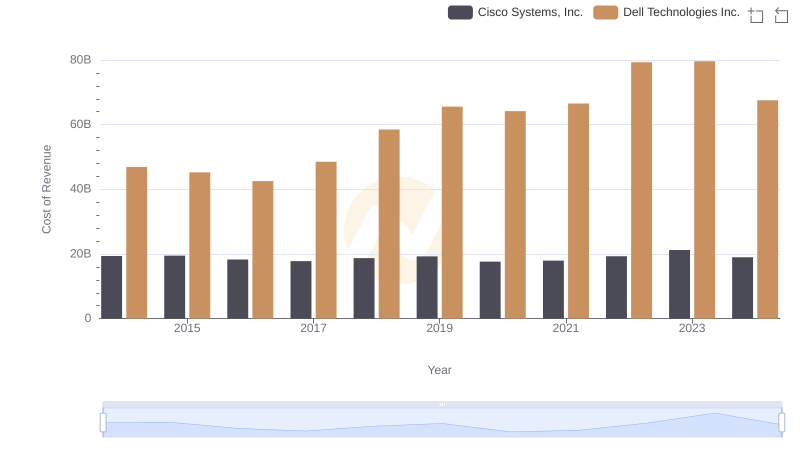
Cost of Revenue: Key Insights for Cisco Systems, Inc. and Dell Technologies Inc.
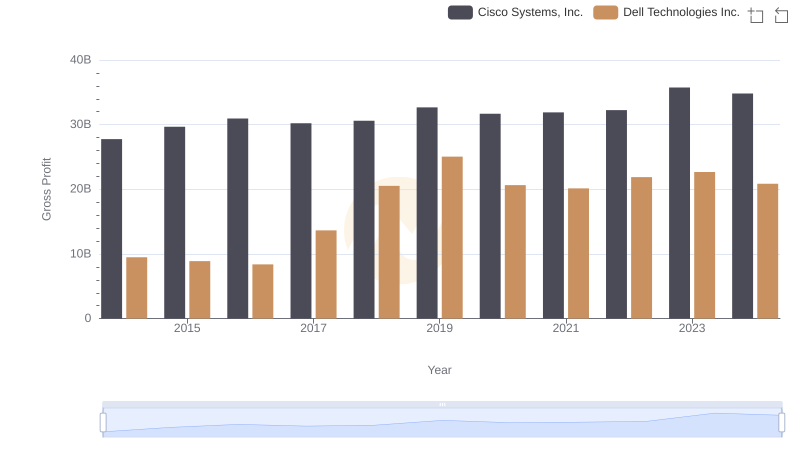
Key Insights on Gross Profit: Cisco Systems, Inc. vs Dell Technologies Inc.
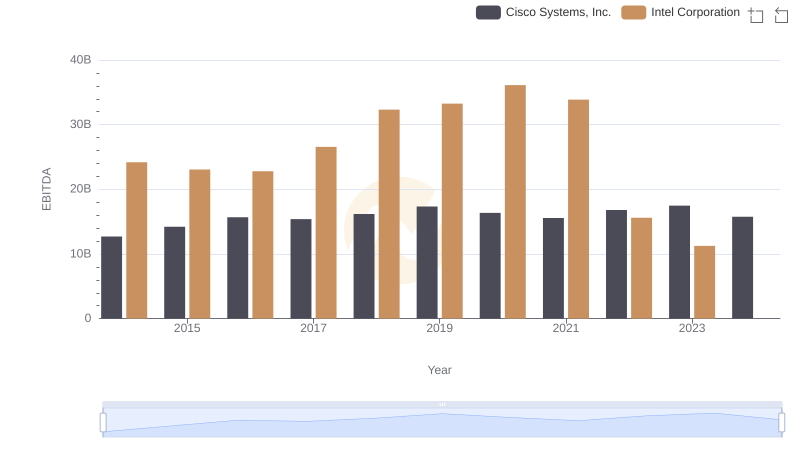
EBITDA Metrics Evaluated: Cisco Systems, Inc. vs Intel Corporation
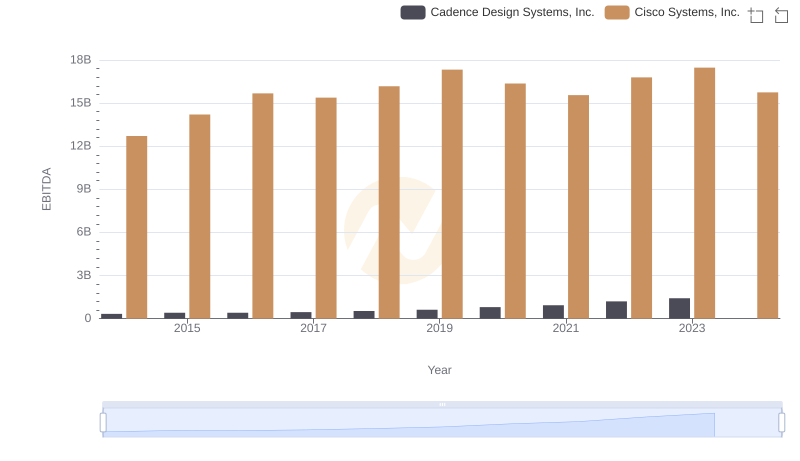
Professional EBITDA Benchmarking: Cisco Systems, Inc. vs Cadence Design Systems, Inc.
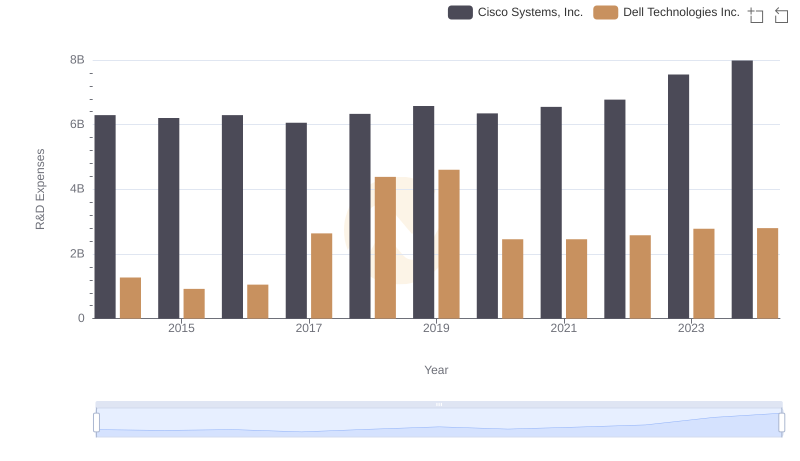
Comparing Innovation Spending: Cisco Systems, Inc. and Dell Technologies Inc.
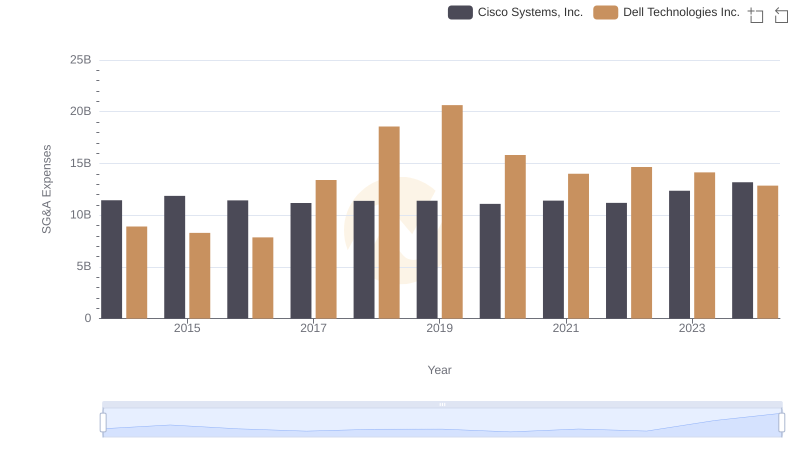
Comparing SG&A Expenses: Cisco Systems, Inc. vs Dell Technologies Inc. Trends and Insights
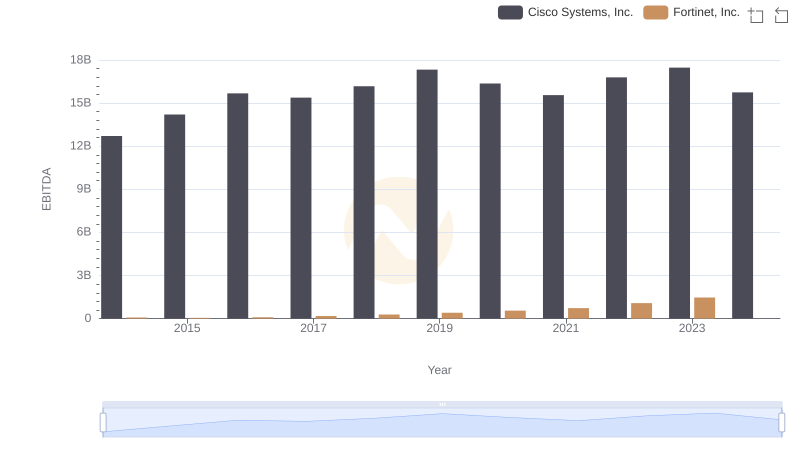
EBITDA Metrics Evaluated: Cisco Systems, Inc. vs Fortinet, Inc.
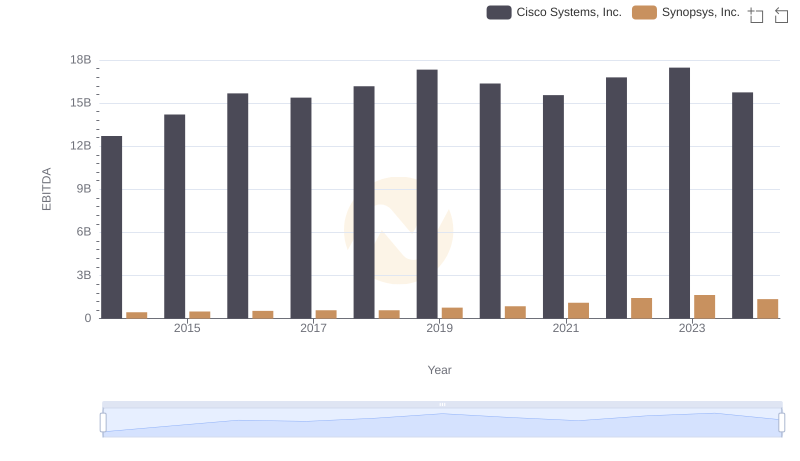
Comparative EBITDA Analysis: Cisco Systems, Inc. vs Synopsys, Inc.
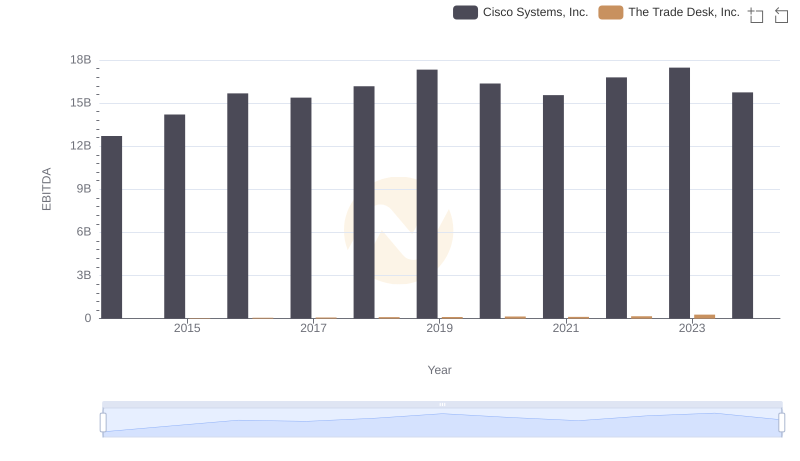
Professional EBITDA Benchmarking: Cisco Systems, Inc. vs The Trade Desk, Inc.
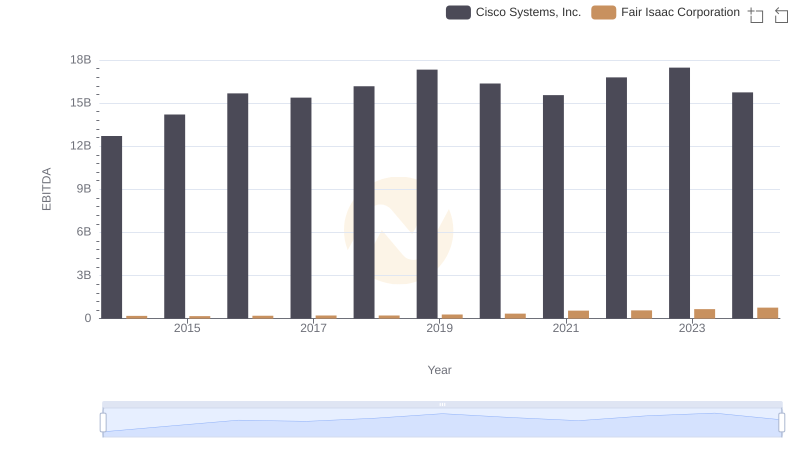
EBITDA Analysis: Evaluating Cisco Systems, Inc. Against Fair Isaac Corporation
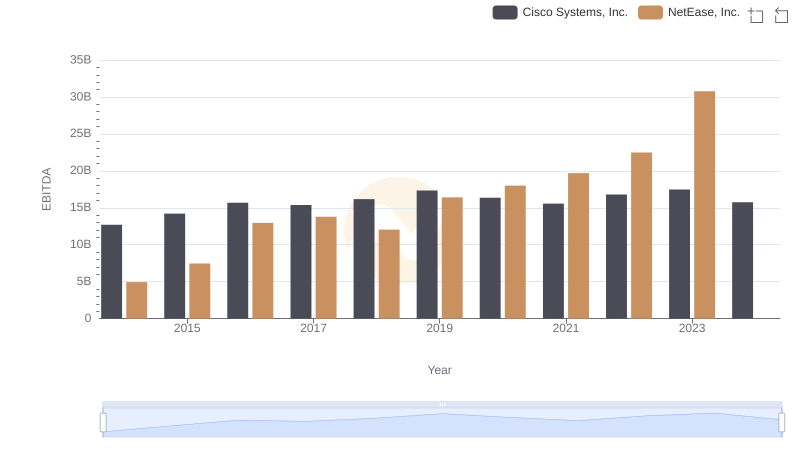
Comparative EBITDA Analysis: Cisco Systems, Inc. vs NetEase, Inc.