| __timestamp | Cisco Systems, Inc. | Dell Technologies Inc. |
|---|---|---|
| Wednesday, January 1, 2014 | 11437000000 | 8906000000 |
| Thursday, January 1, 2015 | 11861000000 | 8292000000 |
| Friday, January 1, 2016 | 11433000000 | 7850000000 |
| Sunday, January 1, 2017 | 11177000000 | 13403000000 |
| Monday, January 1, 2018 | 11386000000 | 18569000000 |
| Tuesday, January 1, 2019 | 11398000000 | 20640000000 |
| Wednesday, January 1, 2020 | 11094000000 | 15819000000 |
| Friday, January 1, 2021 | 11411000000 | 14000000000 |
| Saturday, January 1, 2022 | 11186000000 | 14655000000 |
| Sunday, January 1, 2023 | 12358000000 | 14136000000 |
| Monday, January 1, 2024 | 13177000000 | 12857000000 |
Infusing magic into the data realm
In the ever-evolving tech industry, understanding the financial strategies of giants like Cisco Systems, Inc. and Dell Technologies Inc. is crucial. Over the past decade, from 2014 to 2024, these companies have shown distinct trends in their Selling, General, and Administrative (SG&A) expenses. Cisco's SG&A expenses have remained relatively stable, with a slight increase of about 15% from 2014 to 2024. In contrast, Dell's expenses surged by approximately 44% during the same period, peaking in 2019. This divergence highlights Dell's aggressive expansion and restructuring efforts post-2016, while Cisco maintained a more conservative approach. The data reveals that despite economic fluctuations, both companies have strategically managed their operational costs, reflecting their adaptability and resilience in a competitive market. As we move forward, these insights provide a window into the financial health and strategic priorities of these tech titans.
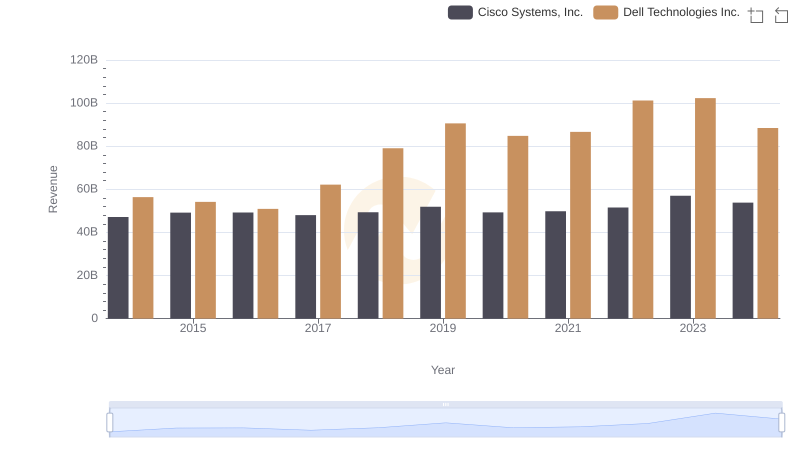
Who Generates More Revenue? Cisco Systems, Inc. or Dell Technologies Inc.
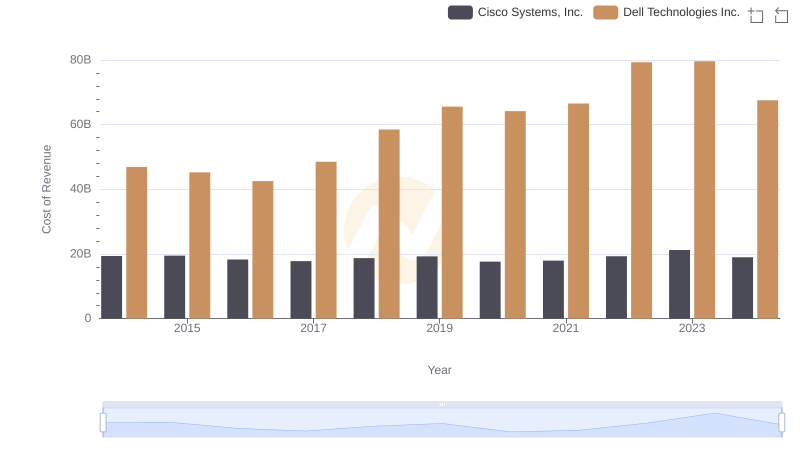
Cost of Revenue: Key Insights for Cisco Systems, Inc. and Dell Technologies Inc.
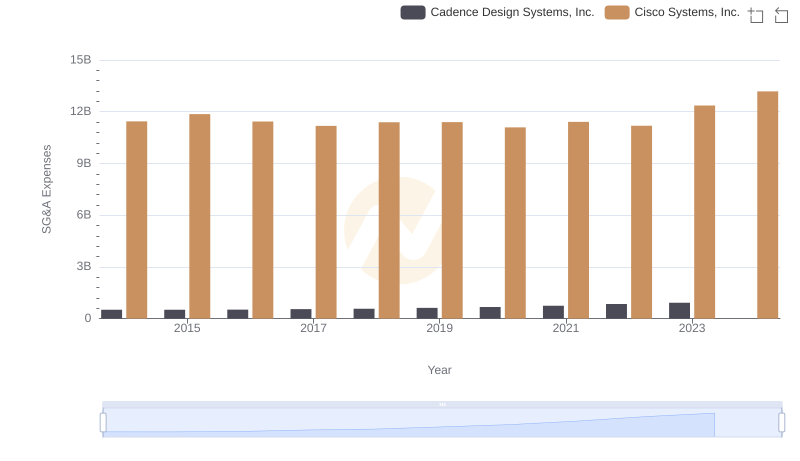
Cisco Systems, Inc. vs Cadence Design Systems, Inc.: SG&A Expense Trends
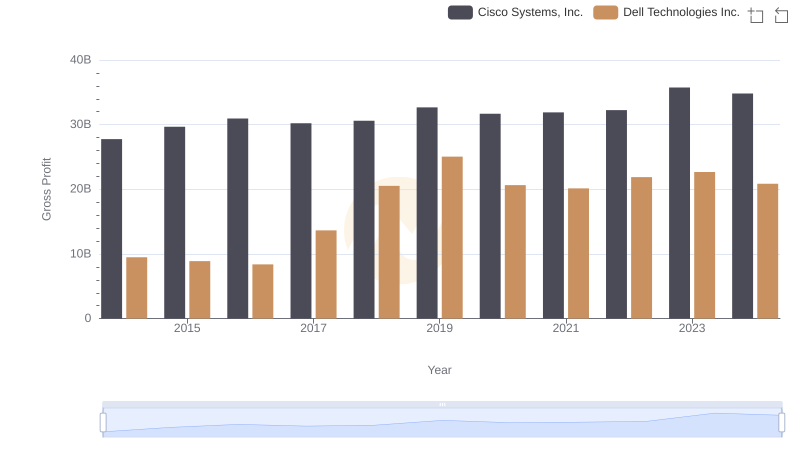
Key Insights on Gross Profit: Cisco Systems, Inc. vs Dell Technologies Inc.
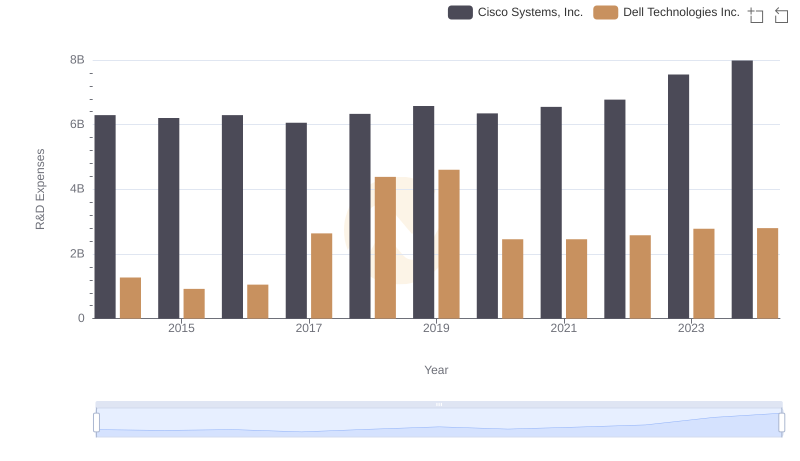
Comparing Innovation Spending: Cisco Systems, Inc. and Dell Technologies Inc.
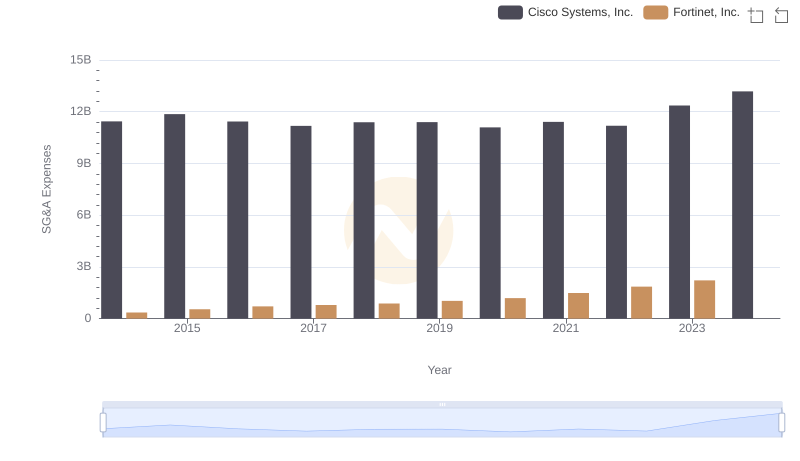
Selling, General, and Administrative Costs: Cisco Systems, Inc. vs Fortinet, Inc.
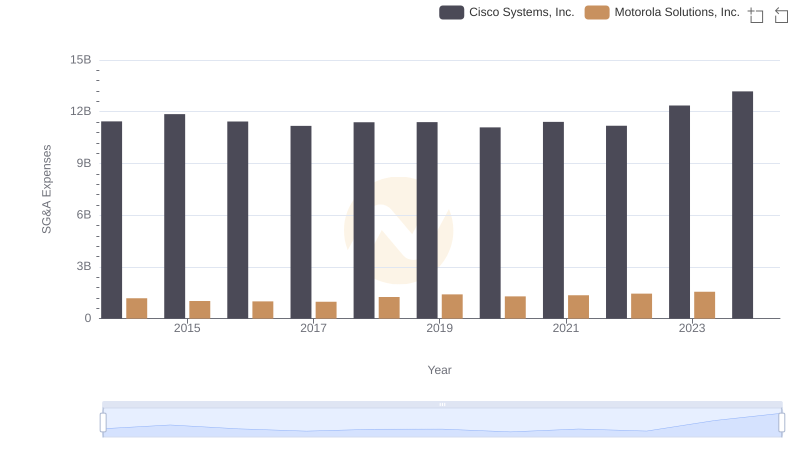
Cisco Systems, Inc. or Motorola Solutions, Inc.: Who Manages SG&A Costs Better?
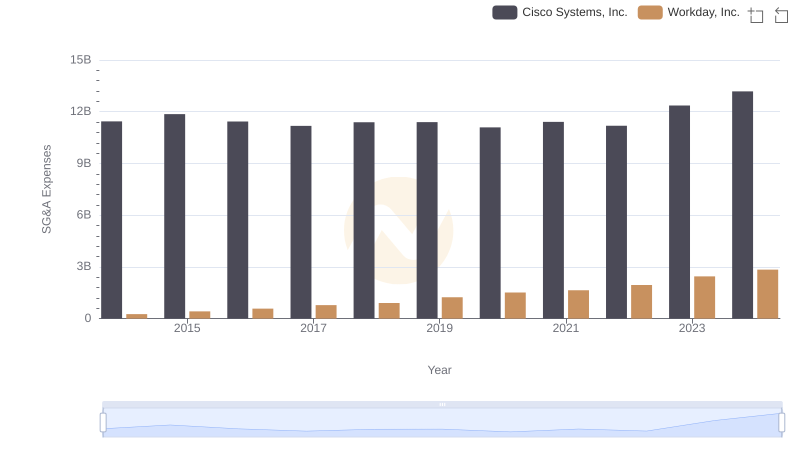
Comparing SG&A Expenses: Cisco Systems, Inc. vs Workday, Inc. Trends and Insights
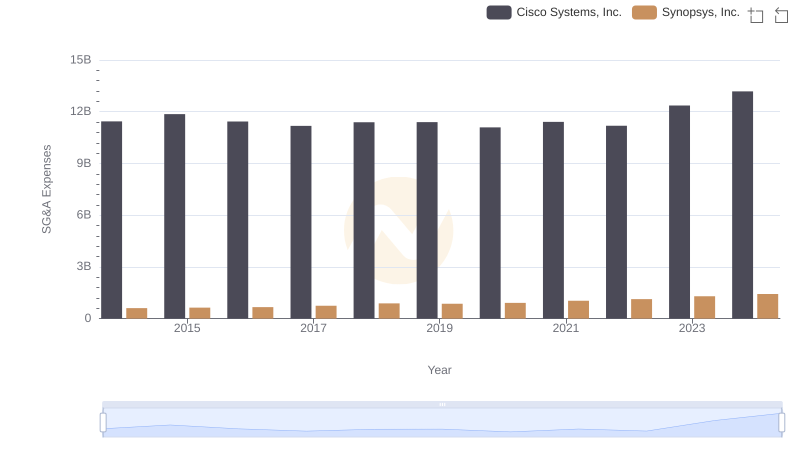
Who Optimizes SG&A Costs Better? Cisco Systems, Inc. or Synopsys, Inc.
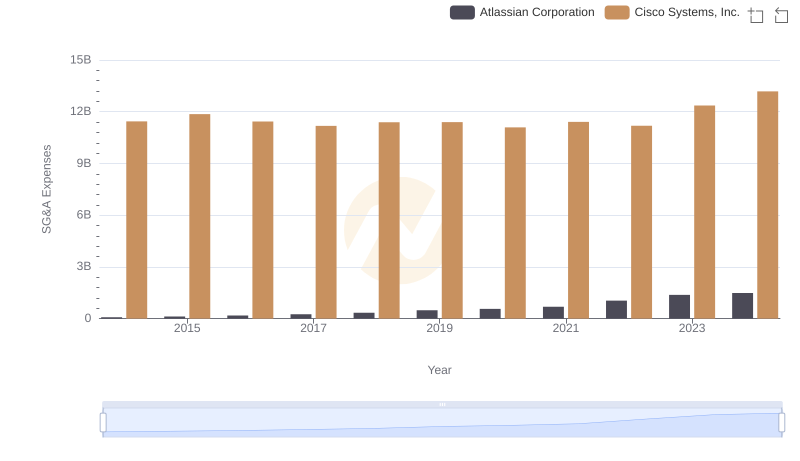
Comparing SG&A Expenses: Cisco Systems, Inc. vs Atlassian Corporation Trends and Insights
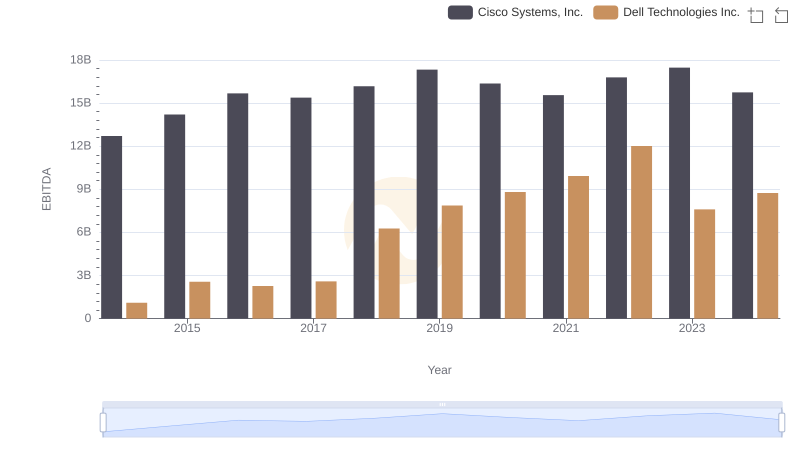
Professional EBITDA Benchmarking: Cisco Systems, Inc. vs Dell Technologies Inc.
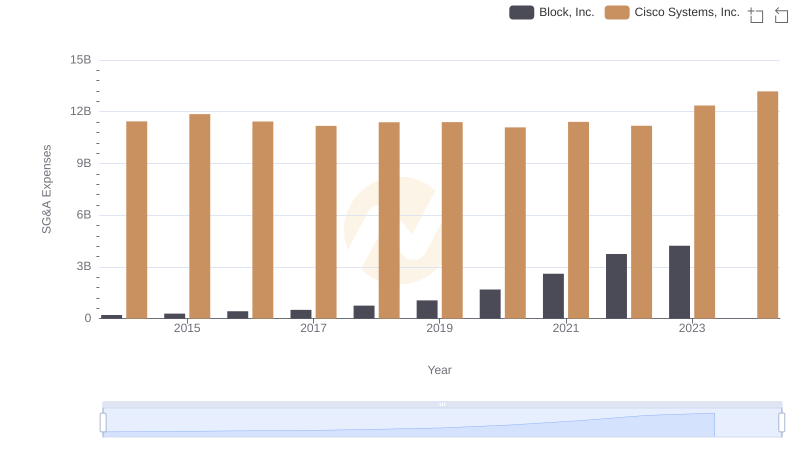
SG&A Efficiency Analysis: Comparing Cisco Systems, Inc. and Block, Inc.