| __timestamp | Cisco Systems, Inc. | Intel Corporation |
|---|---|---|
| Wednesday, January 1, 2014 | 12709000000 | 24191000000 |
| Thursday, January 1, 2015 | 14209000000 | 23067000000 |
| Friday, January 1, 2016 | 15678000000 | 22795000000 |
| Sunday, January 1, 2017 | 15383000000 | 26563000000 |
| Monday, January 1, 2018 | 16172000000 | 32329000000 |
| Tuesday, January 1, 2019 | 17334000000 | 33254000000 |
| Wednesday, January 1, 2020 | 16363000000 | 36115000000 |
| Friday, January 1, 2021 | 15558000000 | 33874000000 |
| Saturday, January 1, 2022 | 16794000000 | 15610000000 |
| Sunday, January 1, 2023 | 17471000000 | 11242000000 |
| Monday, January 1, 2024 | 15747000000 | 1203000000 |
Unleashing insights
In the ever-evolving tech industry, Cisco Systems, Inc. and Intel Corporation have long been titans. From 2014 to 2023, these companies have showcased contrasting EBITDA trajectories. Cisco's EBITDA grew steadily, peaking in 2023 with a 37% increase from 2014. Meanwhile, Intel's EBITDA saw a dramatic rise until 2020, reaching its zenith with a 49% increase from 2014, before plummeting by 69% in 2023. This stark contrast highlights the volatile nature of the tech sector, where market dynamics and strategic decisions can lead to divergent financial outcomes. Notably, 2024 data for Intel is missing, leaving room for speculation on its future performance. As these giants navigate the complexities of the global market, their financial journeys offer valuable insights into the challenges and opportunities within the tech industry.
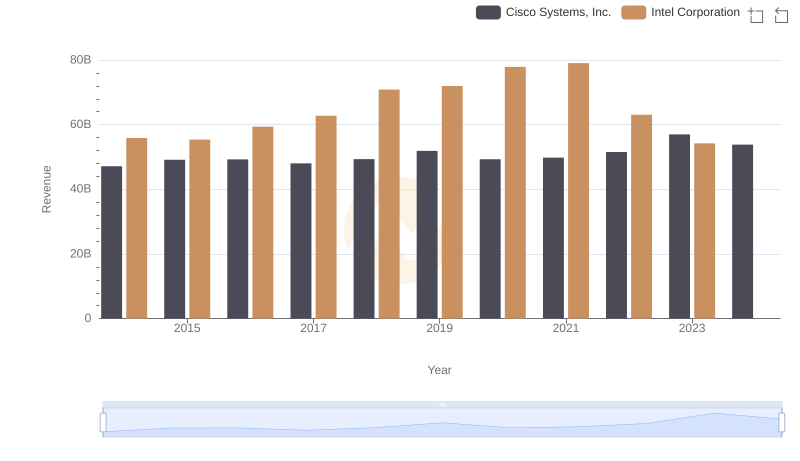
Revenue Showdown: Cisco Systems, Inc. vs Intel Corporation
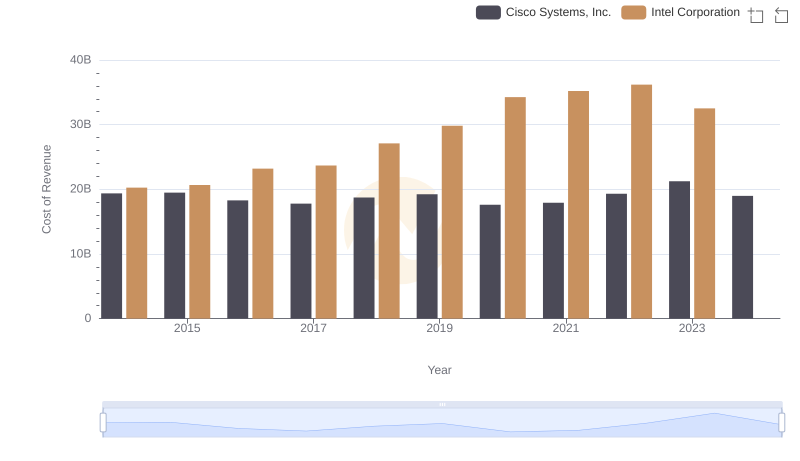
Comparing Cost of Revenue Efficiency: Cisco Systems, Inc. vs Intel Corporation
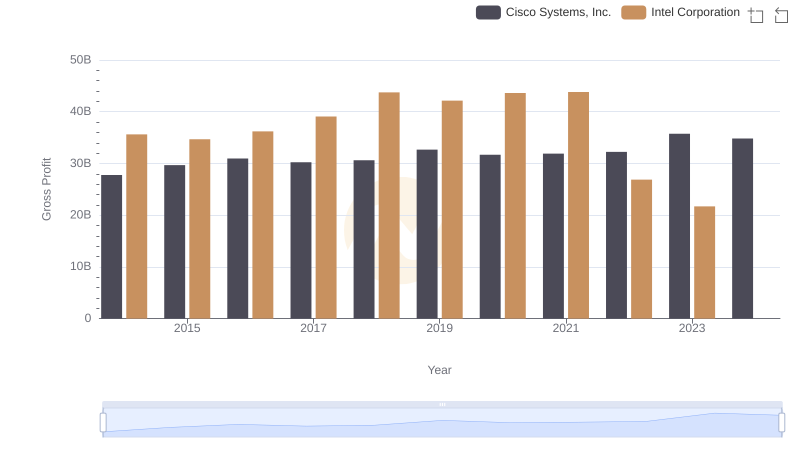
Cisco Systems, Inc. vs Intel Corporation: A Gross Profit Performance Breakdown
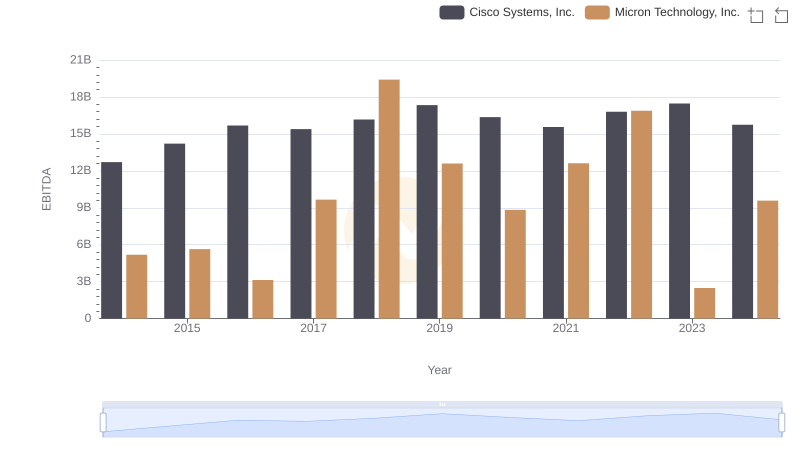
A Side-by-Side Analysis of EBITDA: Cisco Systems, Inc. and Micron Technology, Inc.
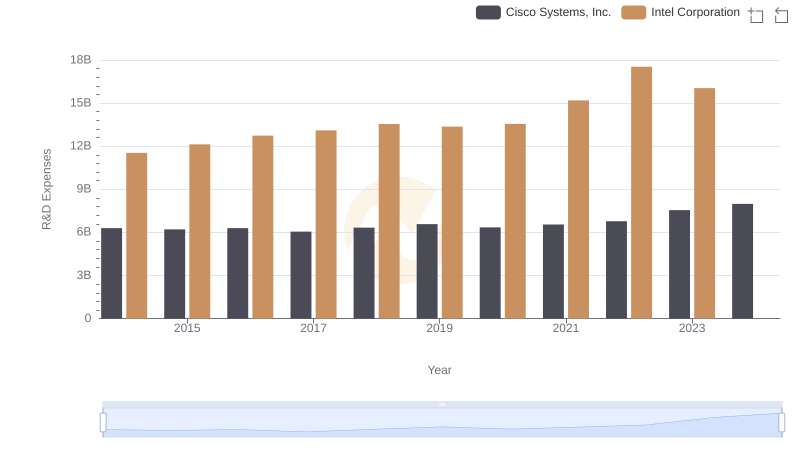
R&D Insights: How Cisco Systems, Inc. and Intel Corporation Allocate Funds
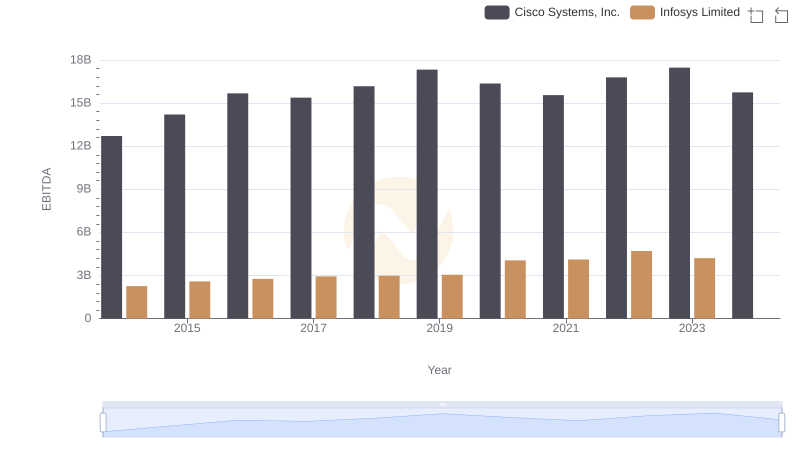
Professional EBITDA Benchmarking: Cisco Systems, Inc. vs Infosys Limited
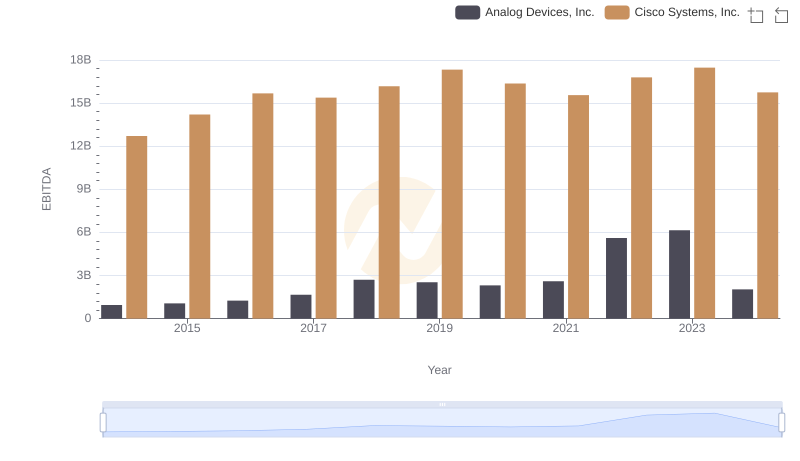
Cisco Systems, Inc. vs Analog Devices, Inc.: In-Depth EBITDA Performance Comparison

A Professional Review of EBITDA: Cisco Systems, Inc. Compared to KLA Corporation
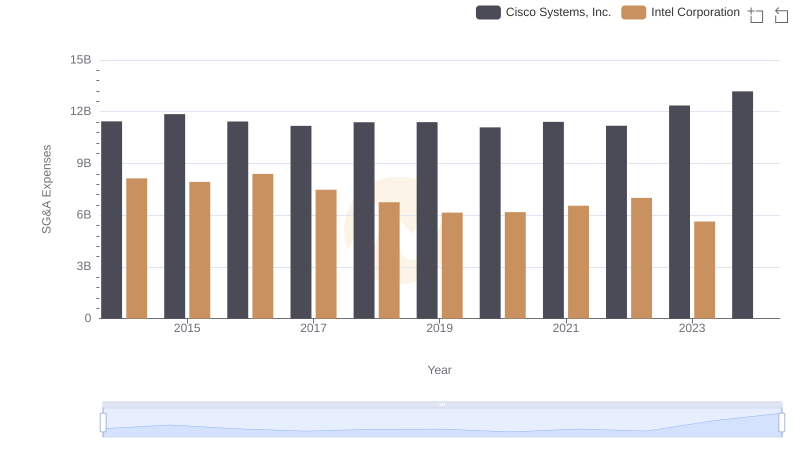
Operational Costs Compared: SG&A Analysis of Cisco Systems, Inc. and Intel Corporation
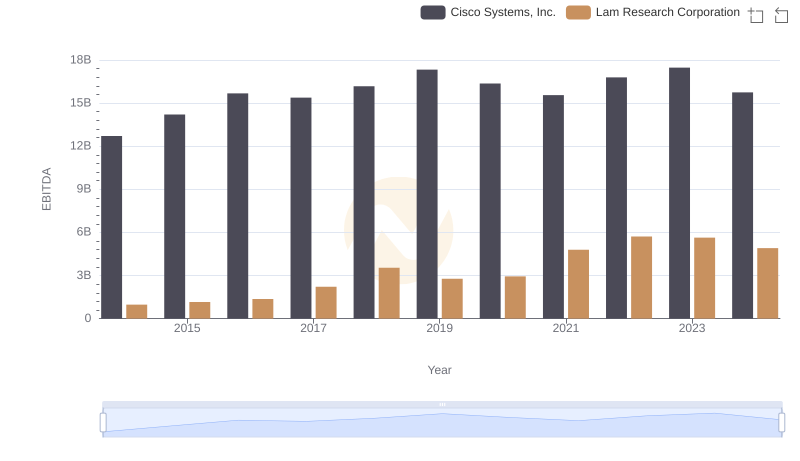
Professional EBITDA Benchmarking: Cisco Systems, Inc. vs Lam Research Corporation
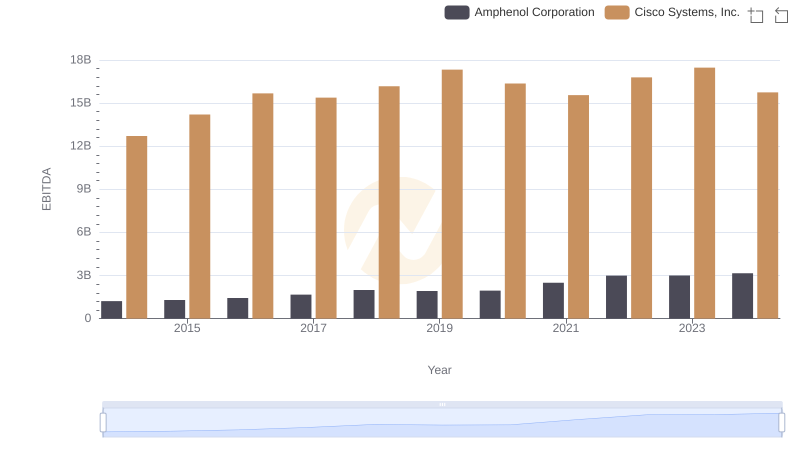
Comprehensive EBITDA Comparison: Cisco Systems, Inc. vs Amphenol Corporation
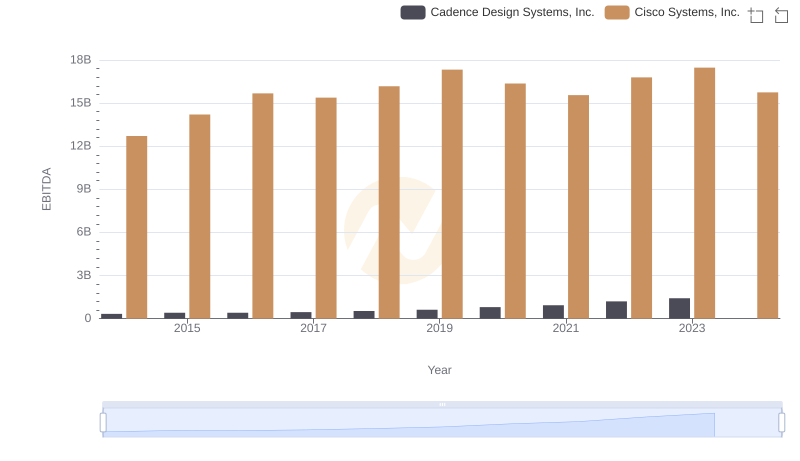
Professional EBITDA Benchmarking: Cisco Systems, Inc. vs Cadence Design Systems, Inc.