| __timestamp | Cisco Systems, Inc. | Dell Technologies Inc. |
|---|---|---|
| Wednesday, January 1, 2014 | 19373000000 | 46892000000 |
| Thursday, January 1, 2015 | 19480000000 | 45246000000 |
| Friday, January 1, 2016 | 18287000000 | 42524000000 |
| Sunday, January 1, 2017 | 17781000000 | 48515000000 |
| Monday, January 1, 2018 | 18724000000 | 58503000000 |
| Tuesday, January 1, 2019 | 19238000000 | 65568000000 |
| Wednesday, January 1, 2020 | 17618000000 | 64176000000 |
| Friday, January 1, 2021 | 17924000000 | 66530000000 |
| Saturday, January 1, 2022 | 19309000000 | 79306000000 |
| Sunday, January 1, 2023 | 21245000000 | 79615000000 |
| Monday, January 1, 2024 | 18975000000 | 67556000000 |
Infusing magic into the data realm
In the ever-evolving tech landscape, understanding cost structures is pivotal. Cisco Systems, Inc. and Dell Technologies Inc., two giants in the industry, have shown intriguing trends in their cost of revenue from 2014 to 2024. Cisco's cost of revenue has remained relatively stable, averaging around $19 billion annually, with a notable peak in 2023 at approximately $21 billion. This represents a 10% increase from its lowest point in 2020. On the other hand, Dell's cost of revenue has seen a more dynamic trajectory, peaking in 2023 at nearly $80 billion, a staggering 87% increase from its 2016 low. These trends highlight Dell's aggressive growth strategy compared to Cisco's steady approach. As we move forward, these insights provide a window into the strategic priorities of these tech behemoths, offering valuable lessons for investors and industry watchers alike.
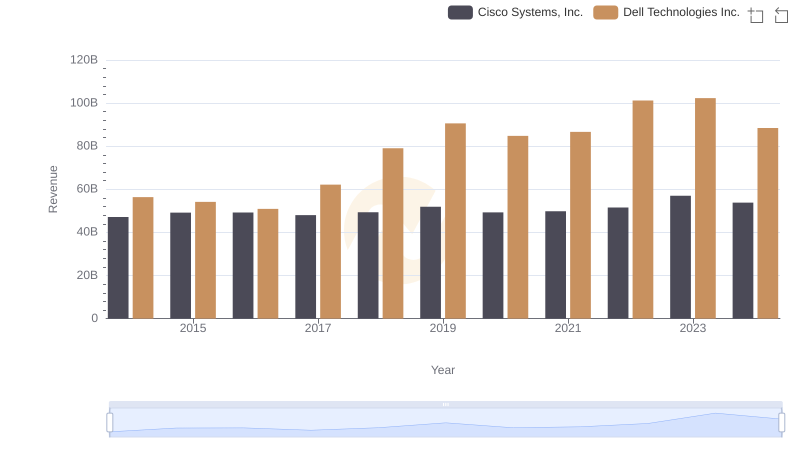
Who Generates More Revenue? Cisco Systems, Inc. or Dell Technologies Inc.
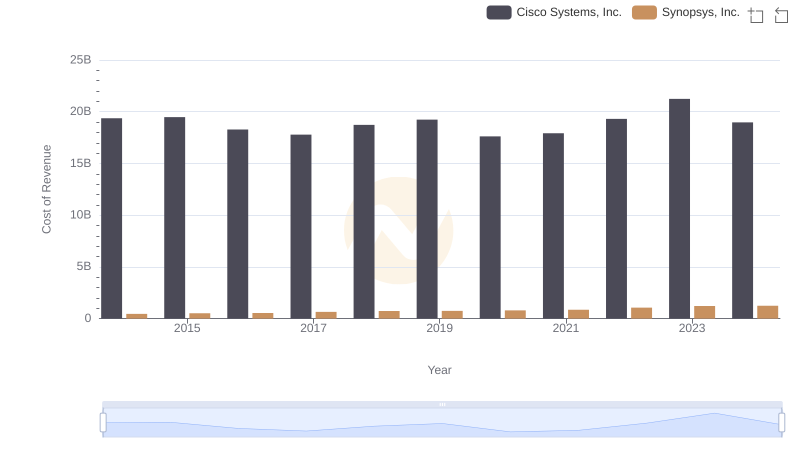
Cost of Revenue: Key Insights for Cisco Systems, Inc. and Synopsys, Inc.
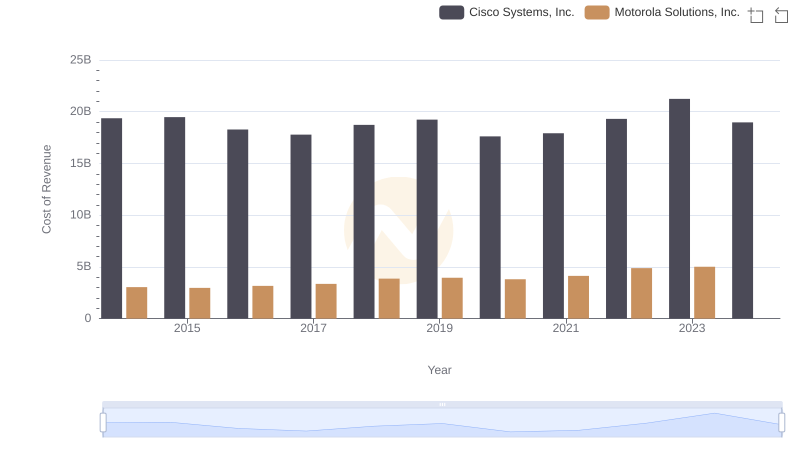
Cost of Revenue Comparison: Cisco Systems, Inc. vs Motorola Solutions, Inc.
Comparing Cost of Revenue Efficiency: Cisco Systems, Inc. vs Fortinet, Inc.
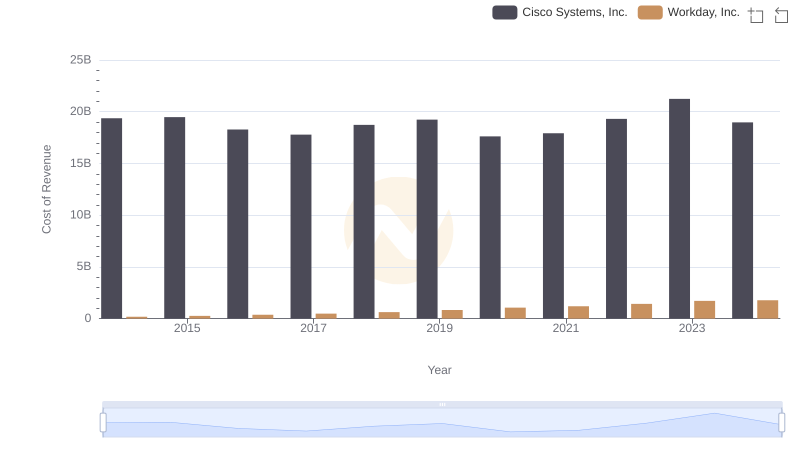
Cost of Revenue: Key Insights for Cisco Systems, Inc. and Workday, Inc.
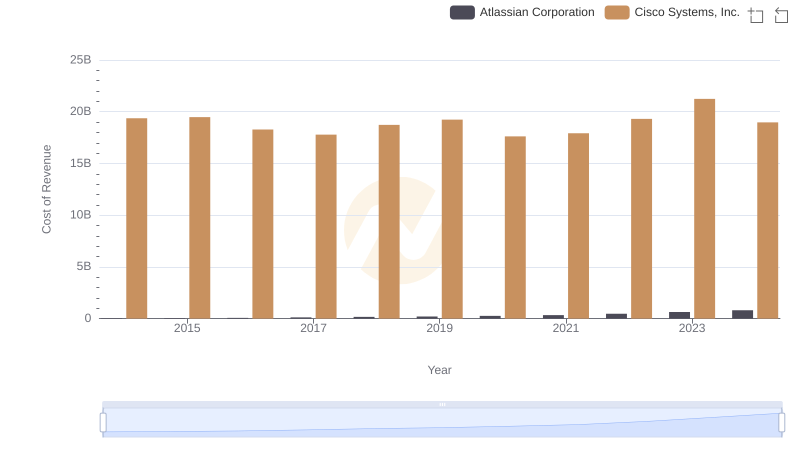
Cost of Revenue Comparison: Cisco Systems, Inc. vs Atlassian Corporation
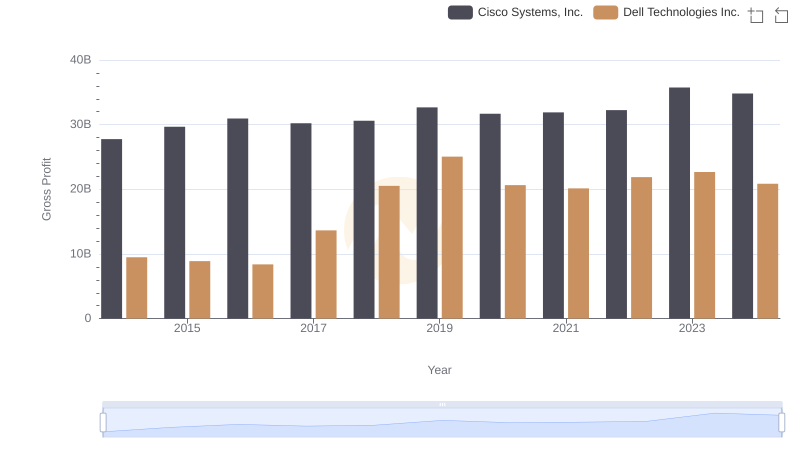
Key Insights on Gross Profit: Cisco Systems, Inc. vs Dell Technologies Inc.
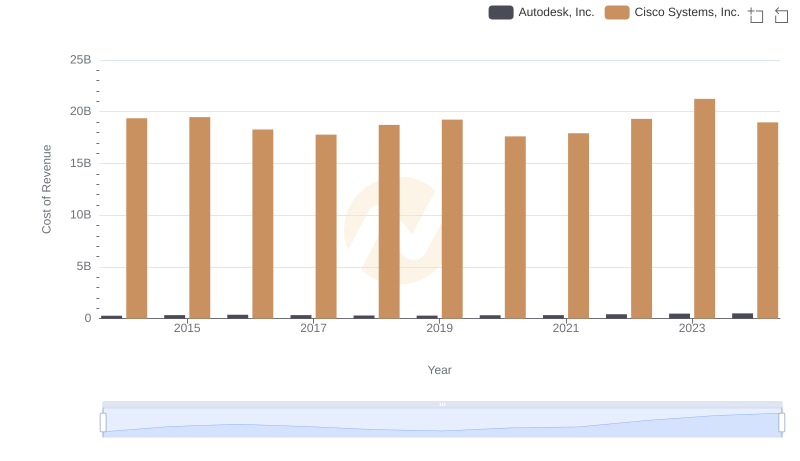
Cost Insights: Breaking Down Cisco Systems, Inc. and Autodesk, Inc.'s Expenses
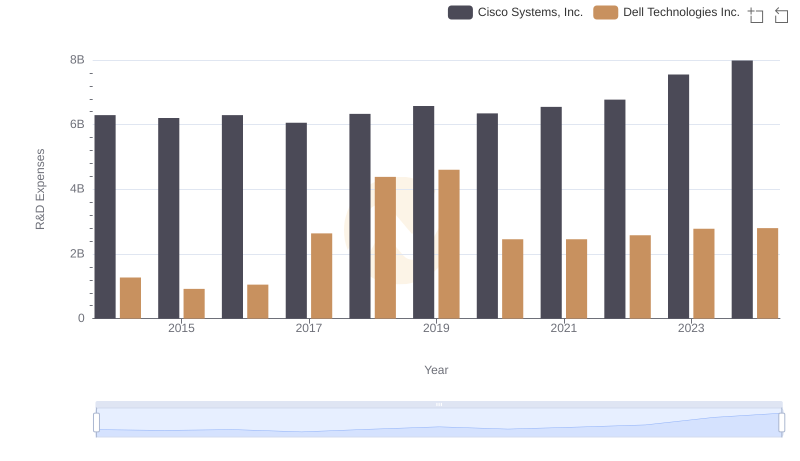
Comparing Innovation Spending: Cisco Systems, Inc. and Dell Technologies Inc.
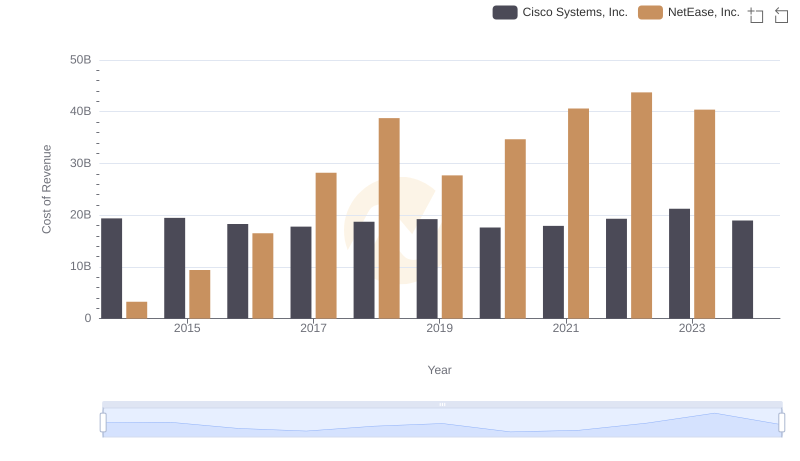
Cost of Revenue: Key Insights for Cisco Systems, Inc. and NetEase, Inc.
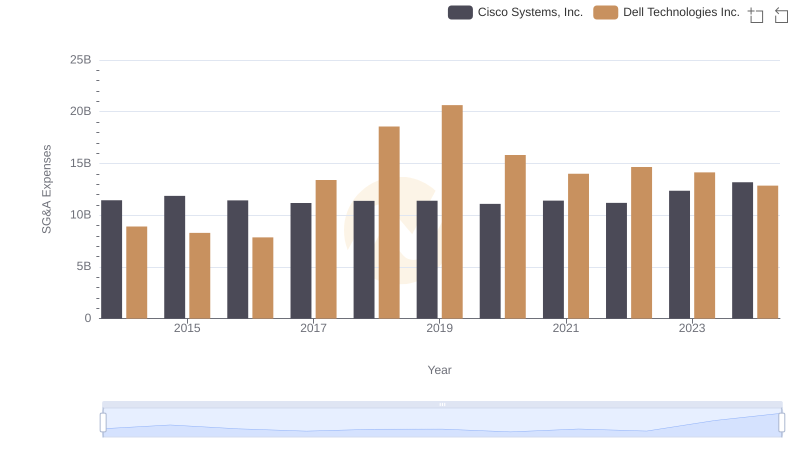
Comparing SG&A Expenses: Cisco Systems, Inc. vs Dell Technologies Inc. Trends and Insights
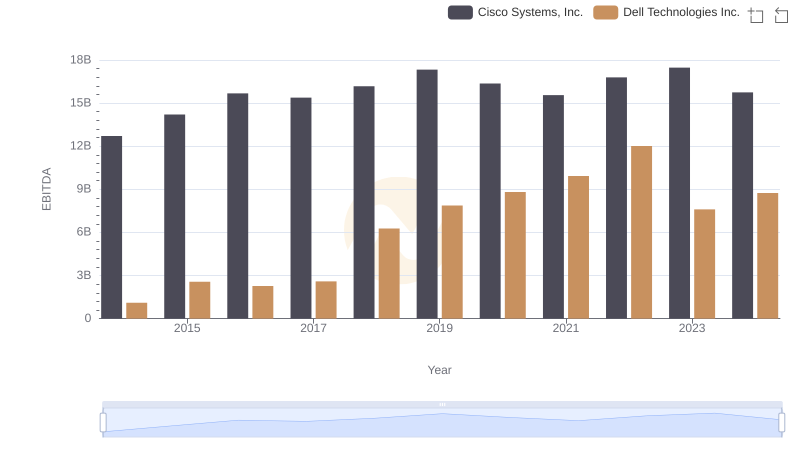
Professional EBITDA Benchmarking: Cisco Systems, Inc. vs Dell Technologies Inc.