| __timestamp | Cadence Design Systems, Inc. | Cisco Systems, Inc. |
|---|---|---|
| Wednesday, January 1, 2014 | 332530000 | 12709000000 |
| Thursday, January 1, 2015 | 408806000 | 14209000000 |
| Friday, January 1, 2016 | 406544000 | 15678000000 |
| Sunday, January 1, 2017 | 448885000 | 15383000000 |
| Monday, January 1, 2018 | 526019000 | 16172000000 |
| Tuesday, January 1, 2019 | 620586000 | 17334000000 |
| Wednesday, January 1, 2020 | 799150000 | 16363000000 |
| Friday, January 1, 2021 | 927723000 | 15558000000 |
| Saturday, January 1, 2022 | 1200385000 | 16794000000 |
| Sunday, January 1, 2023 | 1419630000 | 17471000000 |
| Monday, January 1, 2024 | 1350763000 | 15747000000 |
In pursuit of knowledge
In the ever-evolving tech landscape, Cisco Systems, Inc. and Cadence Design Systems, Inc. have emerged as formidable players. Over the past decade, Cisco's EBITDA has consistently dwarfed that of Cadence, with figures peaking at approximately $17.5 billion in 2023. This represents a steady growth of around 38% from 2014. Meanwhile, Cadence has shown remarkable progress, with its EBITDA surging by over 300% from 2014 to 2023, reaching nearly $1.42 billion.
From 2014 to 2023, Cisco's EBITDA has maintained a robust trajectory, reflecting its dominance in the networking sector. Cadence, on the other hand, has demonstrated impressive growth, underscoring its strategic advancements in electronic design automation. The data for 2024 is incomplete, but the trends suggest continued growth for both companies. This comparison highlights the dynamic nature of the tech industry and the strategic maneuvers of these two giants.
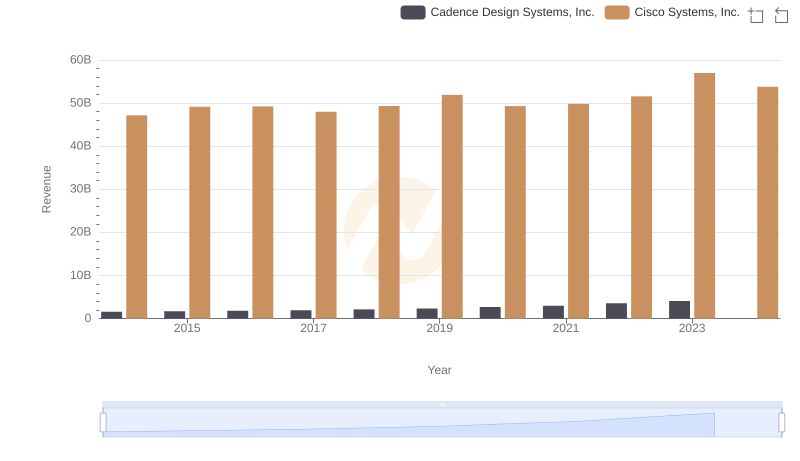
Cisco Systems, Inc. or Cadence Design Systems, Inc.: Who Leads in Yearly Revenue?
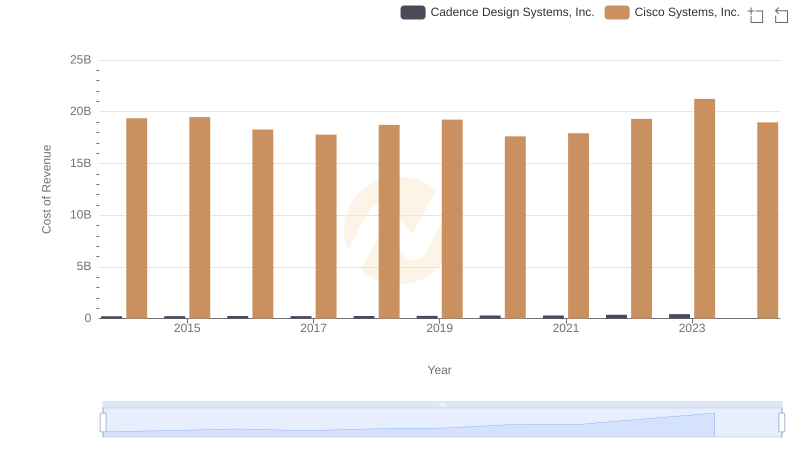
Cost of Revenue: Key Insights for Cisco Systems, Inc. and Cadence Design Systems, Inc.
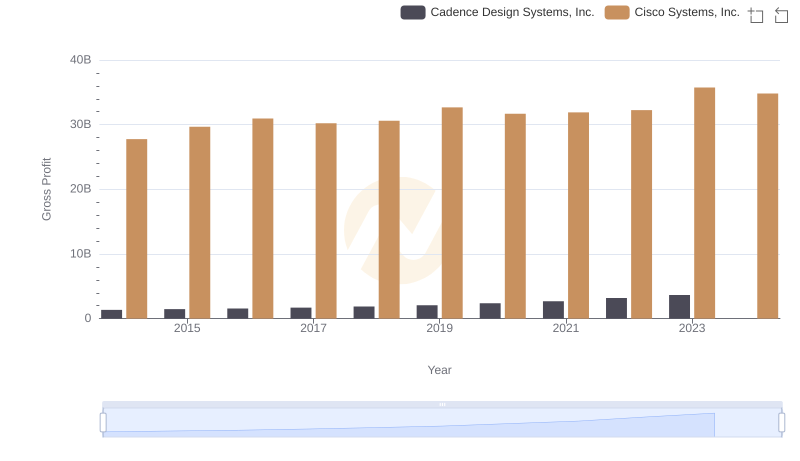
Gross Profit Analysis: Comparing Cisco Systems, Inc. and Cadence Design Systems, Inc.
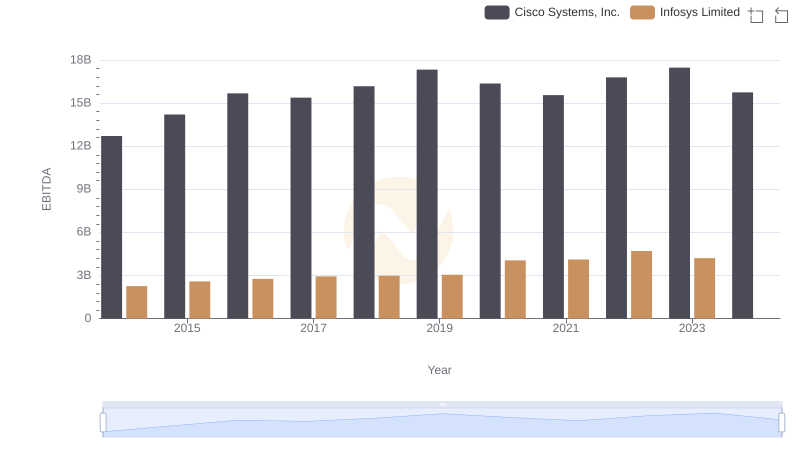
Professional EBITDA Benchmarking: Cisco Systems, Inc. vs Infosys Limited
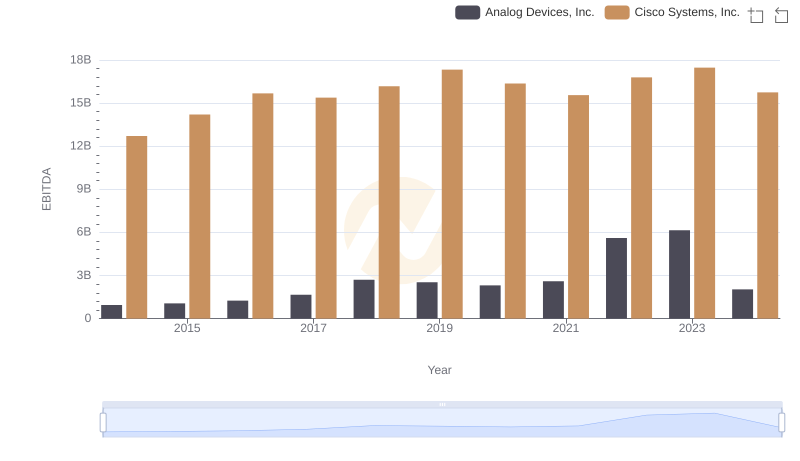
Cisco Systems, Inc. vs Analog Devices, Inc.: In-Depth EBITDA Performance Comparison
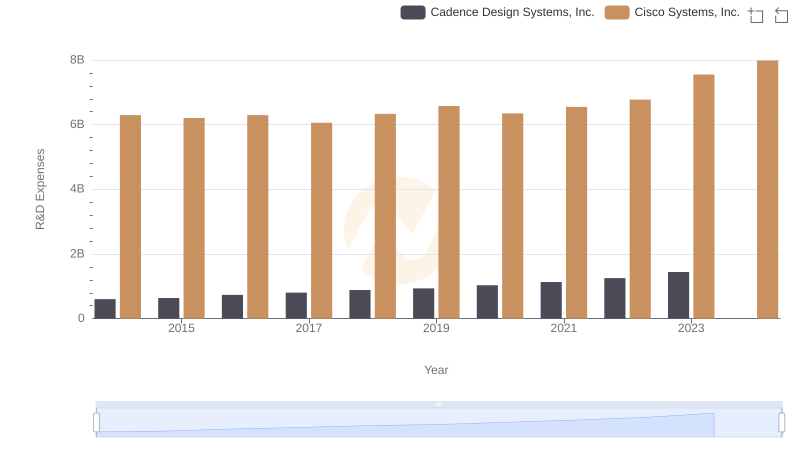
Research and Development Investment: Cisco Systems, Inc. vs Cadence Design Systems, Inc.
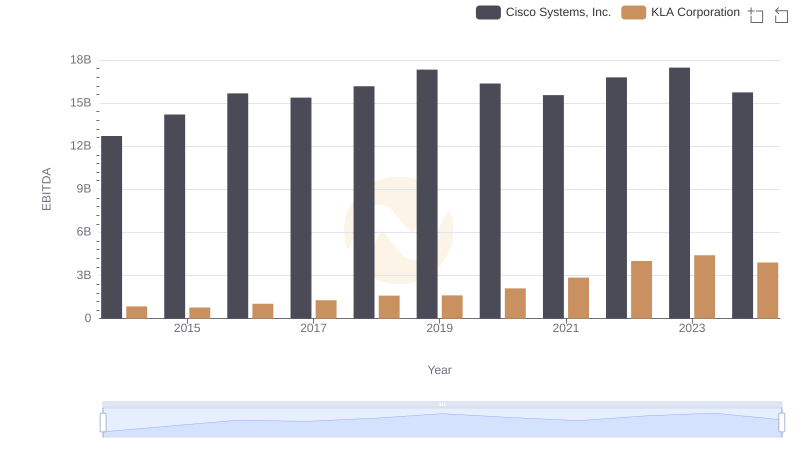
A Professional Review of EBITDA: Cisco Systems, Inc. Compared to KLA Corporation
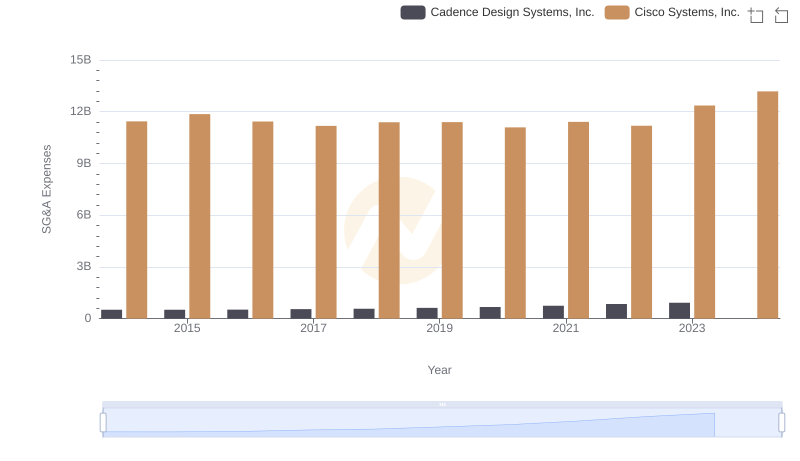
Cisco Systems, Inc. vs Cadence Design Systems, Inc.: SG&A Expense Trends
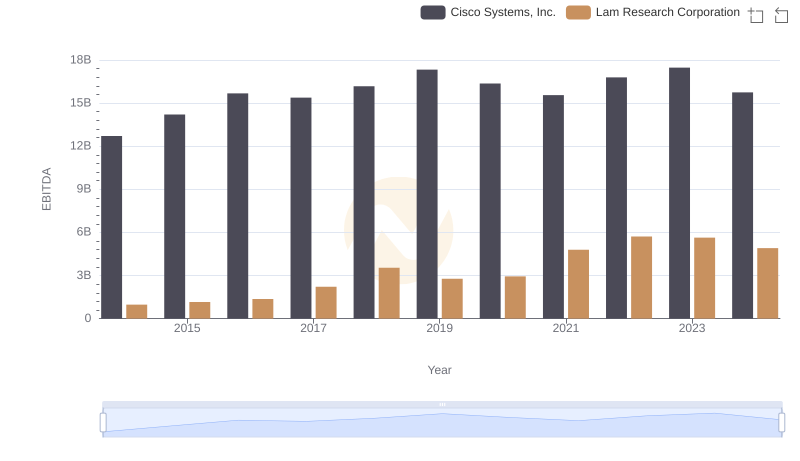
Professional EBITDA Benchmarking: Cisco Systems, Inc. vs Lam Research Corporation
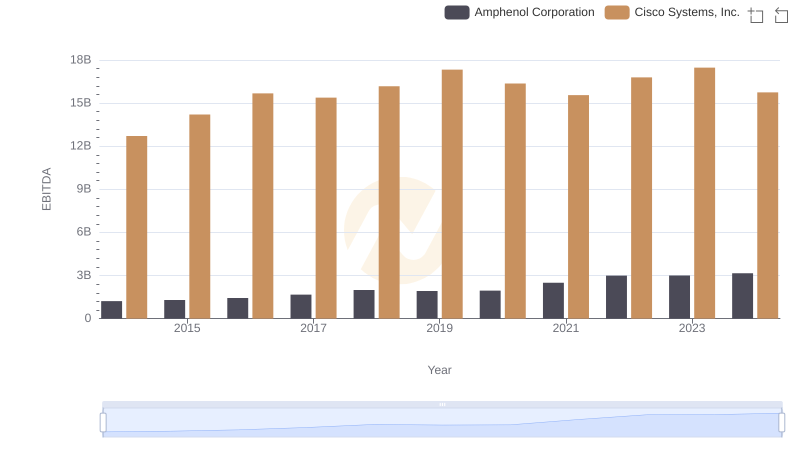
Comprehensive EBITDA Comparison: Cisco Systems, Inc. vs Amphenol Corporation
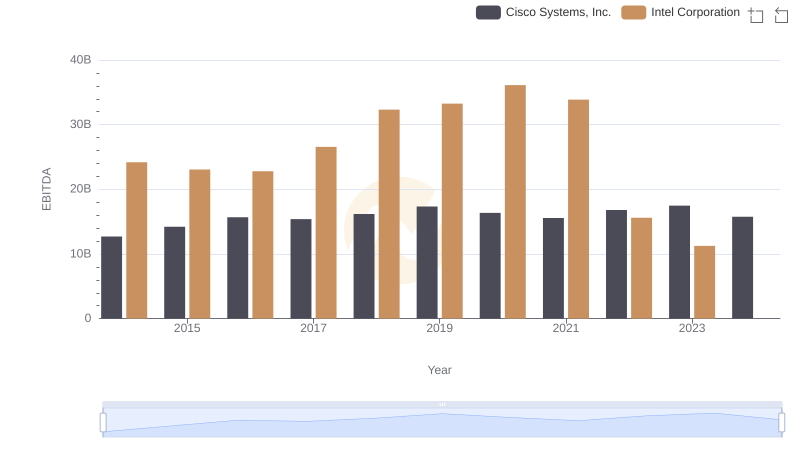
EBITDA Metrics Evaluated: Cisco Systems, Inc. vs Intel Corporation
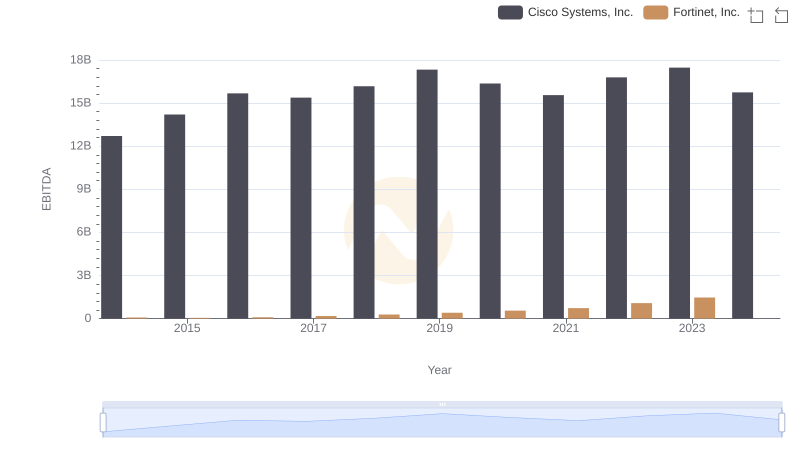
EBITDA Metrics Evaluated: Cisco Systems, Inc. vs Fortinet, Inc.