| __timestamp | AMETEK, Inc. | Xylem Inc. |
|---|---|---|
| Wednesday, January 1, 2014 | 462637000 | 920000000 |
| Thursday, January 1, 2015 | 448592000 | 854000000 |
| Friday, January 1, 2016 | 462970000 | 915000000 |
| Sunday, January 1, 2017 | 533645000 | 1090000000 |
| Monday, January 1, 2018 | 584022000 | 1161000000 |
| Tuesday, January 1, 2019 | 610280000 | 1158000000 |
| Wednesday, January 1, 2020 | 515630000 | 1143000000 |
| Friday, January 1, 2021 | 603944000 | 1179000000 |
| Saturday, January 1, 2022 | 644577000 | 1227000000 |
| Sunday, January 1, 2023 | 677006000 | 1757000000 |
| Monday, January 1, 2024 | 696905000 |
Data in motion
In the competitive landscape of industrial technology, AMETEK, Inc. and Xylem Inc. have shown distinct trends in their Selling, General, and Administrative (SG&A) expenses over the past decade. From 2014 to 2023, Xylem Inc. consistently outpaced AMETEK, Inc. in SG&A spending, with a notable 57% increase from 2014 to 2023. In contrast, AMETEK, Inc. saw a 46% rise in the same period.
Xylem's SG&A expenses peaked in 2023, reaching nearly double that of AMETEK, Inc., reflecting its aggressive expansion and market penetration strategies. Meanwhile, AMETEK, Inc. maintained a steady growth trajectory, with a significant jump in 2023, indicating strategic investments in operational efficiency.
These trends highlight the differing strategic priorities of these industry giants, offering valuable insights for investors and market analysts.
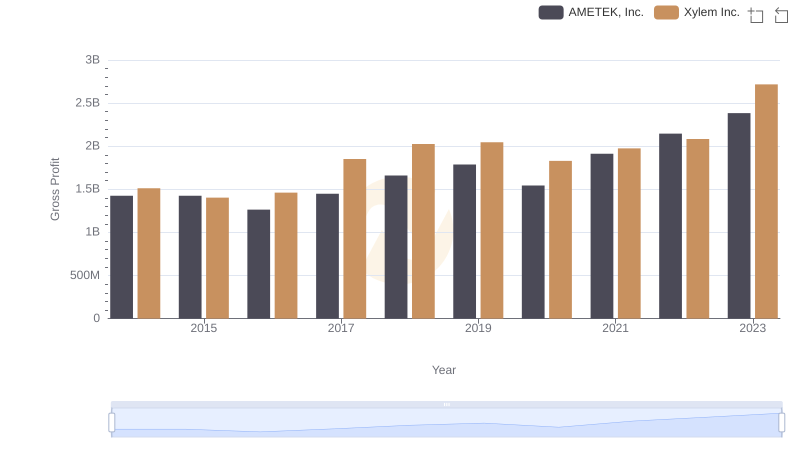
AMETEK, Inc. vs Xylem Inc.: A Gross Profit Performance Breakdown
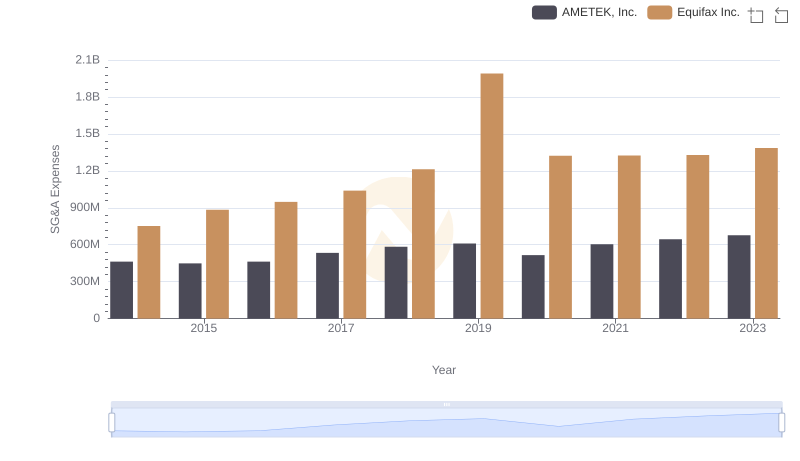
Cost Management Insights: SG&A Expenses for AMETEK, Inc. and Equifax Inc.
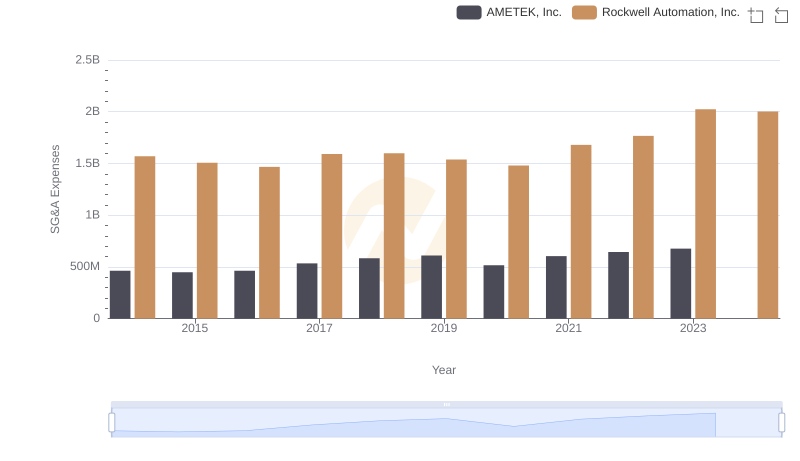
Comparing SG&A Expenses: AMETEK, Inc. vs Rockwell Automation, Inc. Trends and Insights
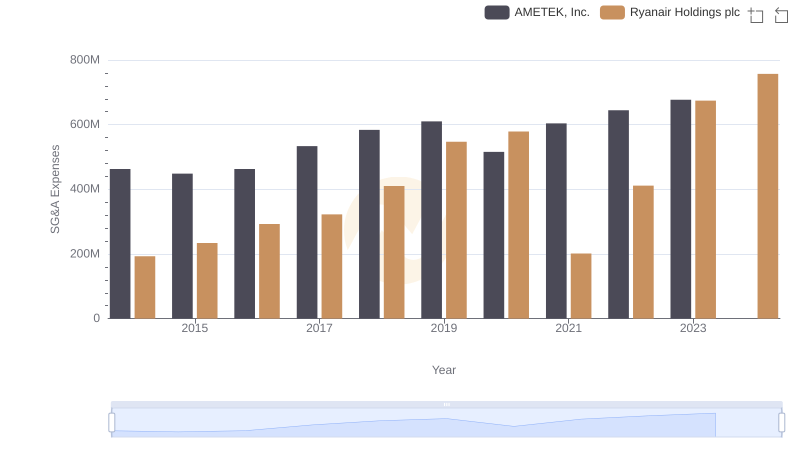
Comparing SG&A Expenses: AMETEK, Inc. vs Ryanair Holdings plc Trends and Insights
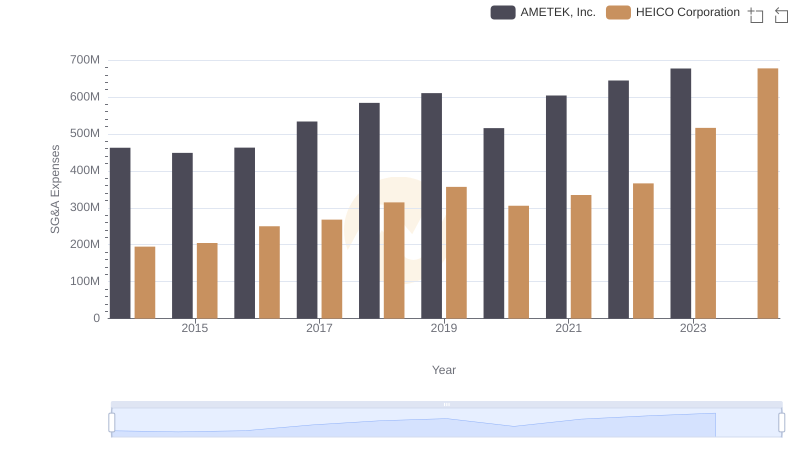
Who Optimizes SG&A Costs Better? AMETEK, Inc. or HEICO Corporation
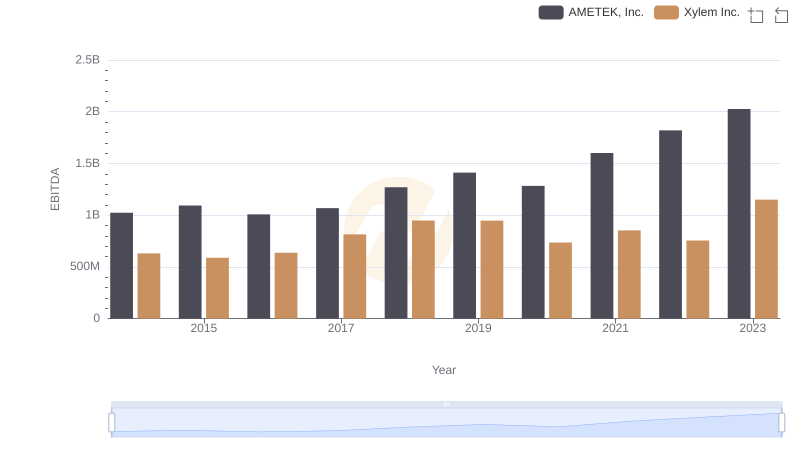
Professional EBITDA Benchmarking: AMETEK, Inc. vs Xylem Inc.
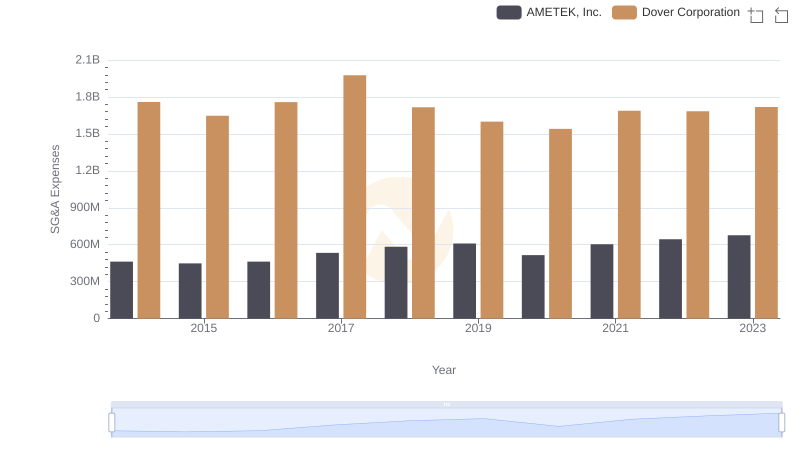
AMETEK, Inc. or Dover Corporation: Who Manages SG&A Costs Better?