| __timestamp | Parker-Hannifin Corporation | Trane Technologies plc |
|---|---|---|
| Wednesday, January 1, 2014 | 1633992000 | 2503900000 |
| Thursday, January 1, 2015 | 1544746000 | 2541100000 |
| Friday, January 1, 2016 | 1359360000 | 2606500000 |
| Sunday, January 1, 2017 | 1453935000 | 2720700000 |
| Monday, January 1, 2018 | 1657152000 | 2903200000 |
| Tuesday, January 1, 2019 | 1543939000 | 3129800000 |
| Wednesday, January 1, 2020 | 1656553000 | 2270600000 |
| Friday, January 1, 2021 | 1527302000 | 2446300000 |
| Saturday, January 1, 2022 | 1627116000 | 2545900000 |
| Sunday, January 1, 2023 | 3354103000 | 2963200000 |
| Monday, January 1, 2024 | 3315177000 | 3580400000 |
Unlocking the unknown
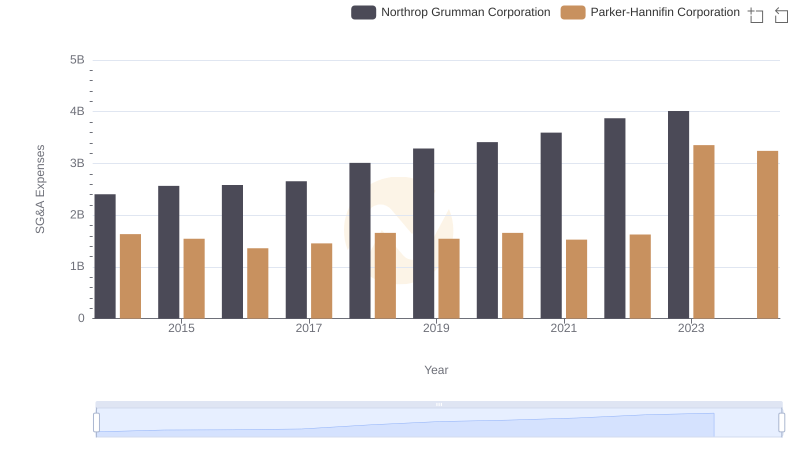
In the competitive landscape of industrial manufacturing, Parker-Hannifin Corporation and Trane Technologies plc have showcased intriguing trends in their Selling, General, and Administrative (SG&A) expenses over the past decade. From 2014 to 2023, Parker-Hannifin's SG&A expenses have seen a significant increase, peaking in 2023 with a staggering 105% rise compared to 2016. This surge reflects strategic investments and possibly increased operational costs. Meanwhile, Trane Technologies experienced a more stable trajectory, with a notable dip in 2020, likely due to pandemic-related adjustments, before rebounding to near-peak levels in 2023. Interestingly, data for 2024 is incomplete, leaving room for speculation on future trends. These insights highlight the dynamic nature of financial strategies in the industrial sector, where companies must balance growth with cost management.
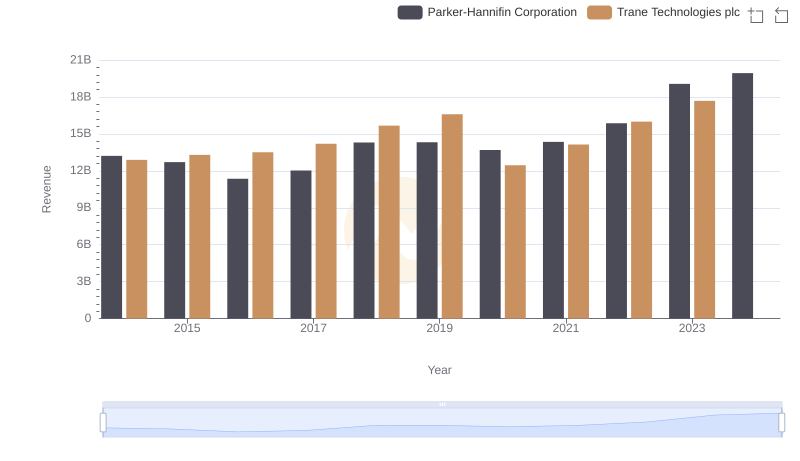
Breaking Down Revenue Trends: Parker-Hannifin Corporation vs Trane Technologies plc
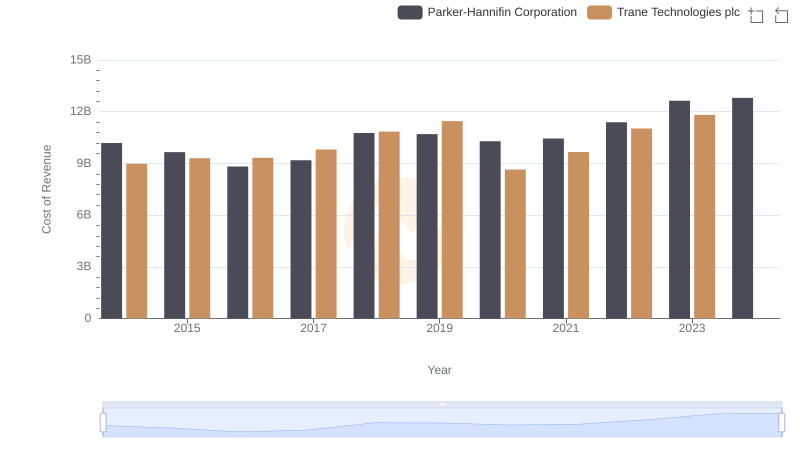
Cost Insights: Breaking Down Parker-Hannifin Corporation and Trane Technologies plc's Expenses
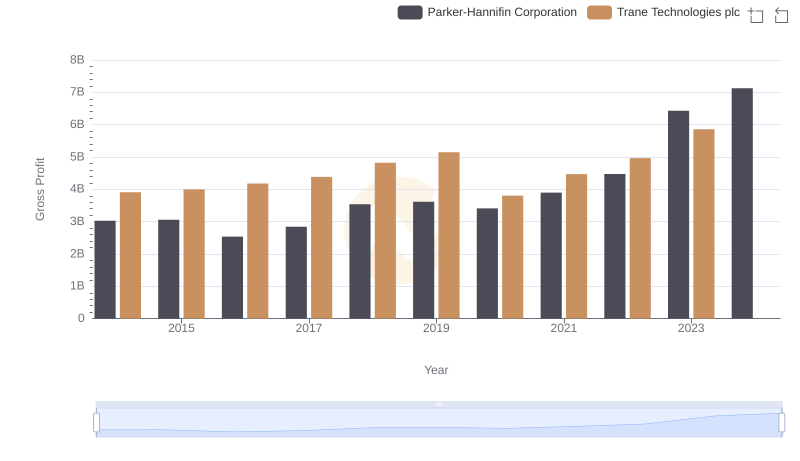
Gross Profit Analysis: Comparing Parker-Hannifin Corporation and Trane Technologies plc
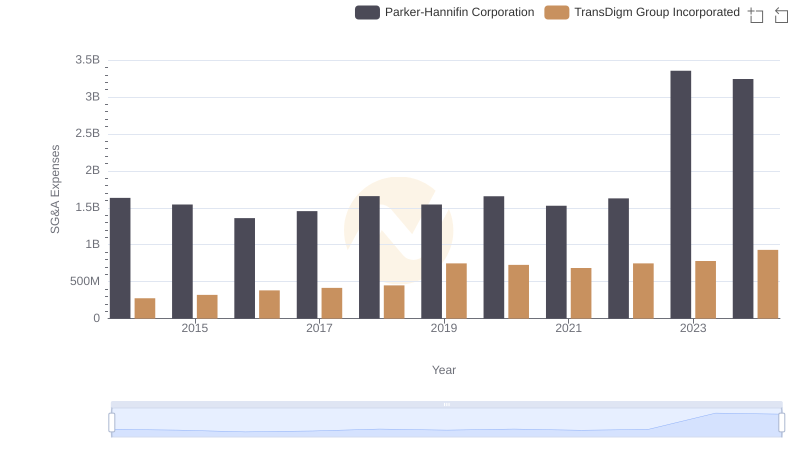
SG&A Efficiency Analysis: Comparing Parker-Hannifin Corporation and TransDigm Group Incorporated
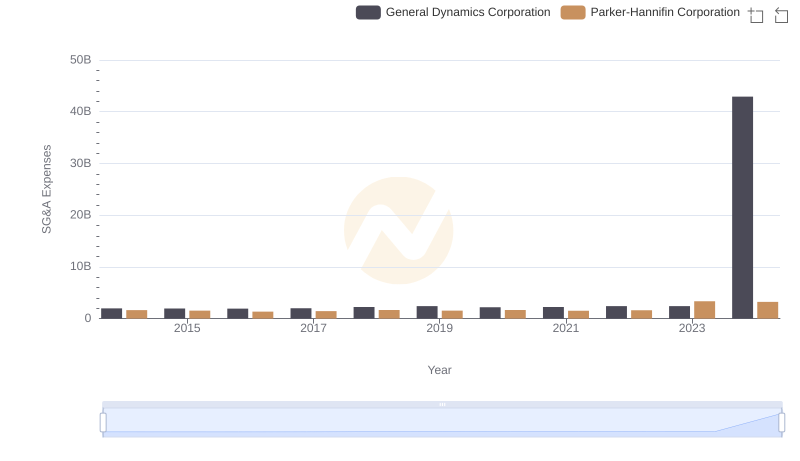
Operational Costs Compared: SG&A Analysis of Parker-Hannifin Corporation and General Dynamics Corporation
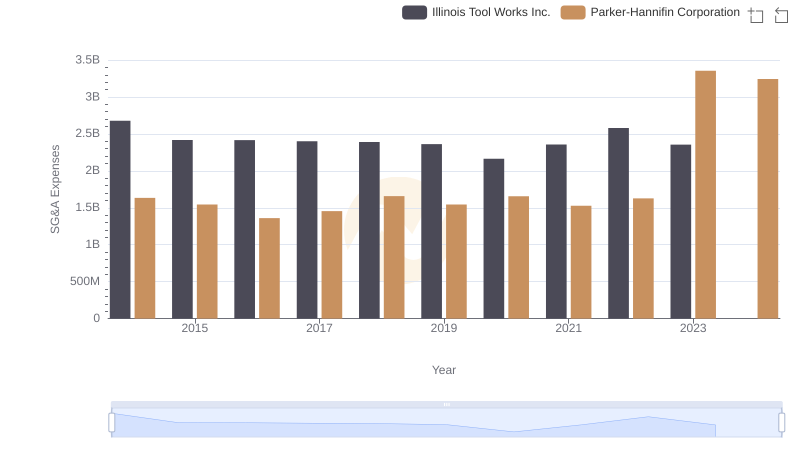
Breaking Down SG&A Expenses: Parker-Hannifin Corporation vs Illinois Tool Works Inc.
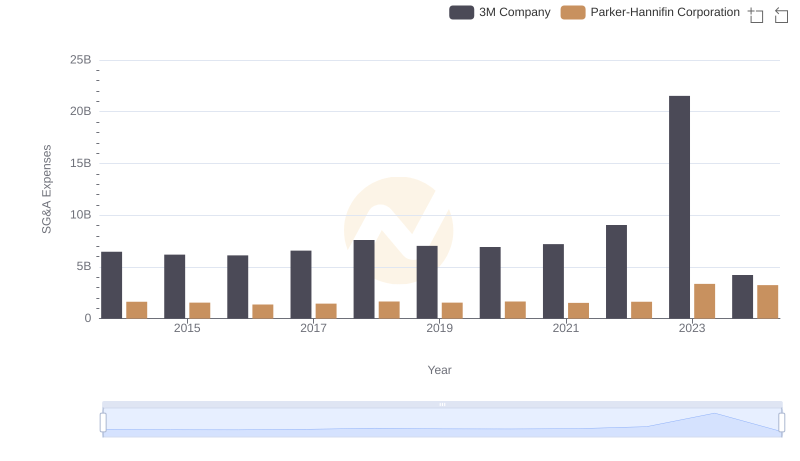
Parker-Hannifin Corporation and 3M Company: SG&A Spending Patterns Compared
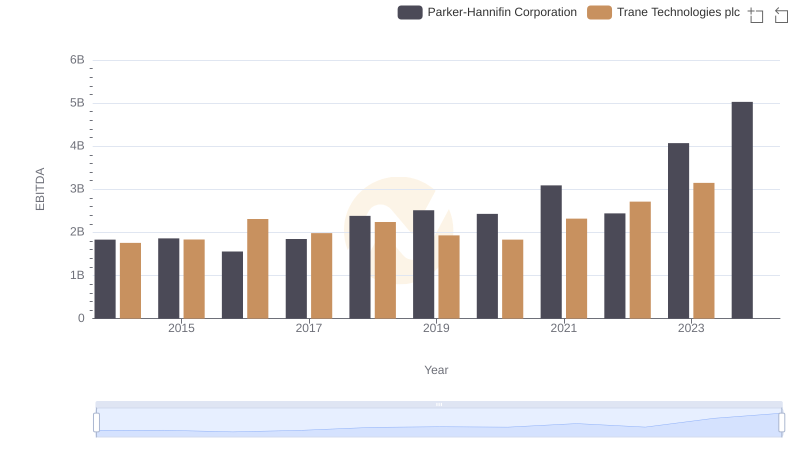
EBITDA Analysis: Evaluating Parker-Hannifin Corporation Against Trane Technologies plc
SG&A Efficiency Analysis: Comparing Parker-Hannifin Corporation and Northrop Grumman Corporation