| __timestamp | Parker-Hannifin Corporation | Trane Technologies plc |
|---|---|---|
| Wednesday, January 1, 2014 | 13215971000 | 12891400000 |
| Thursday, January 1, 2015 | 12711744000 | 13300700000 |
| Friday, January 1, 2016 | 11360753000 | 13508900000 |
| Sunday, January 1, 2017 | 12029312000 | 14197600000 |
| Monday, January 1, 2018 | 14302392000 | 15668200000 |
| Tuesday, January 1, 2019 | 14320324000 | 16598900000 |
| Wednesday, January 1, 2020 | 13695520000 | 12454700000 |
| Friday, January 1, 2021 | 14347640000 | 14136400000 |
| Saturday, January 1, 2022 | 15861608000 | 15991700000 |
| Sunday, January 1, 2023 | 19065194000 | 17677600000 |
| Monday, January 1, 2024 | 19929606000 | 19838200000 |
In pursuit of knowledge
In the ever-evolving industrial landscape, Parker-Hannifin Corporation and Trane Technologies plc have been pivotal players. Over the past decade, Parker-Hannifin has seen a remarkable revenue growth of approximately 51% from 2014 to 2023, peaking at nearly $20 billion in 2023. This growth trajectory underscores its resilience and adaptability in a competitive market.
Conversely, Trane Technologies has demonstrated a steady upward trend, with revenues increasing by about 37% from 2014 to 2023, reaching a high of $17.7 billion. However, data for 2024 is currently unavailable, leaving room for speculation on its future performance.
Both companies have shown robust financial health, with Parker-Hannifin slightly edging out Trane Technologies in recent years. This comparison highlights the dynamic nature of the industrial sector and the strategic maneuvers these giants employ to maintain their market positions.
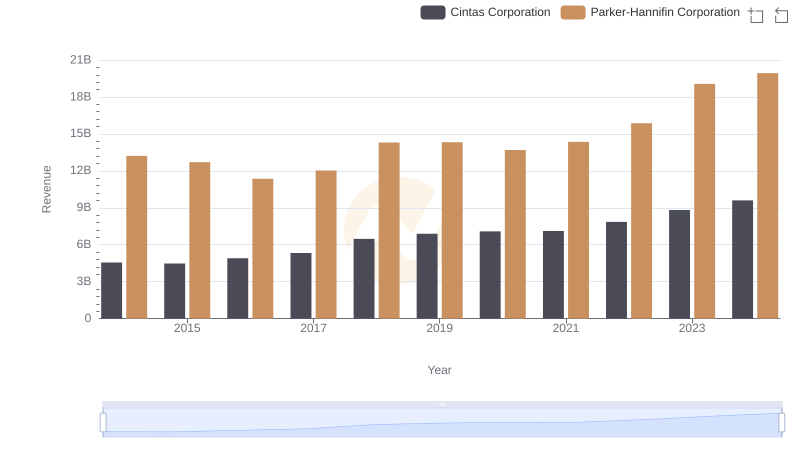
Revenue Showdown: Parker-Hannifin Corporation vs Cintas Corporation
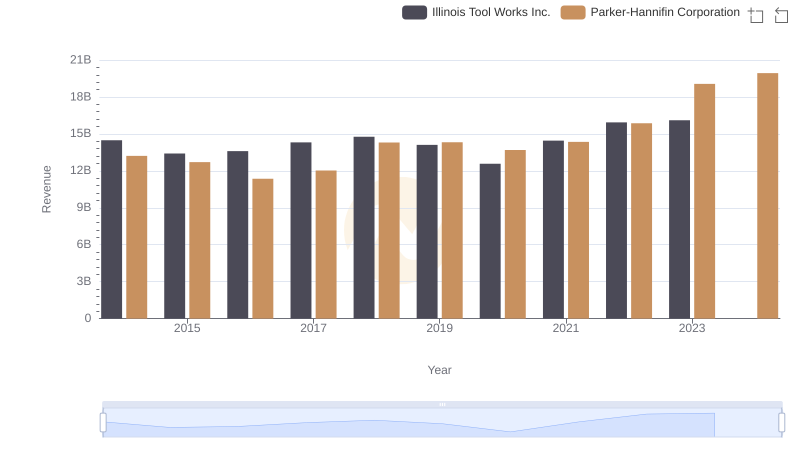
Parker-Hannifin Corporation and Illinois Tool Works Inc.: A Comprehensive Revenue Analysis

Who Generates More Revenue? Parker-Hannifin Corporation or TransDigm Group Incorporated
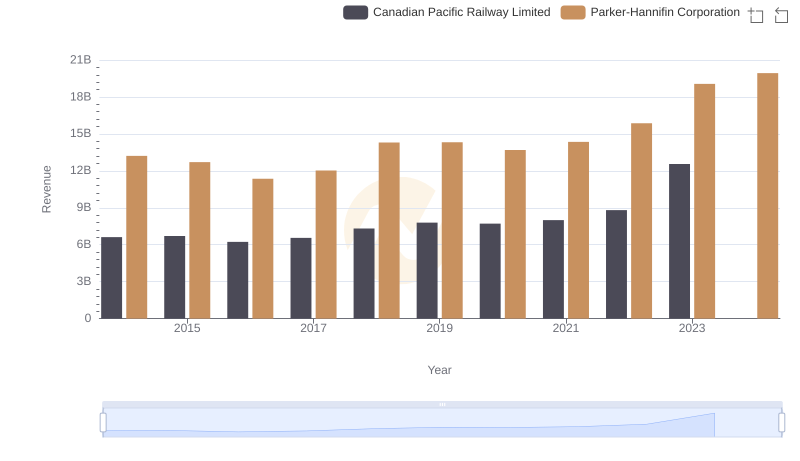
Comparing Revenue Performance: Parker-Hannifin Corporation or Canadian Pacific Railway Limited?
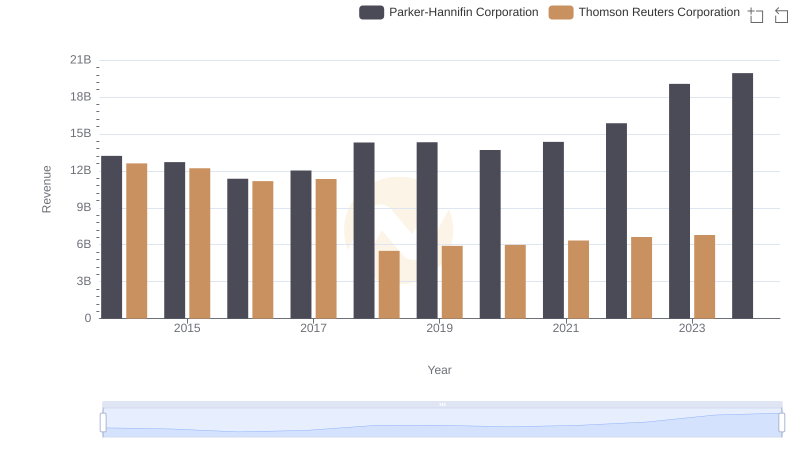
Breaking Down Revenue Trends: Parker-Hannifin Corporation vs Thomson Reuters Corporation
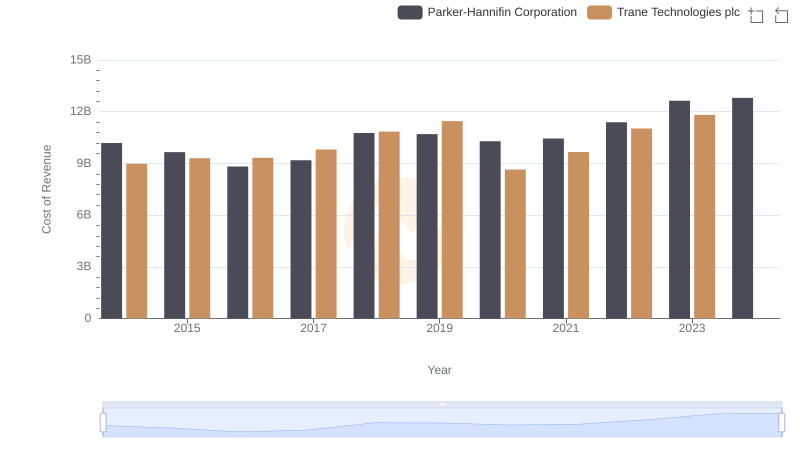
Cost Insights: Breaking Down Parker-Hannifin Corporation and Trane Technologies plc's Expenses
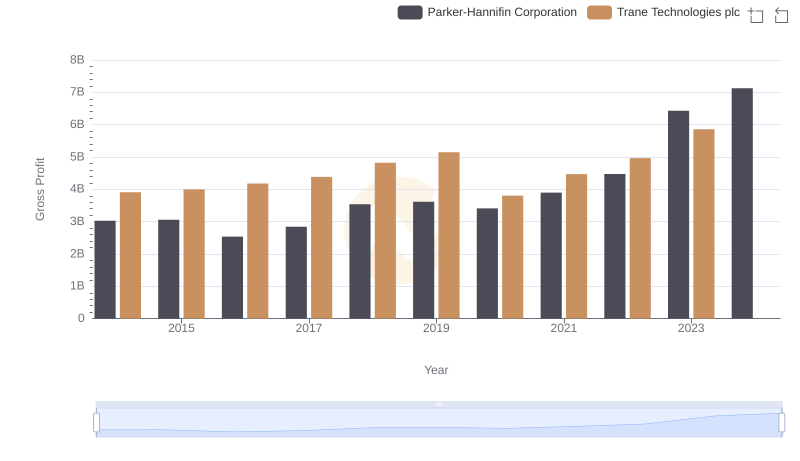
Gross Profit Analysis: Comparing Parker-Hannifin Corporation and Trane Technologies plc
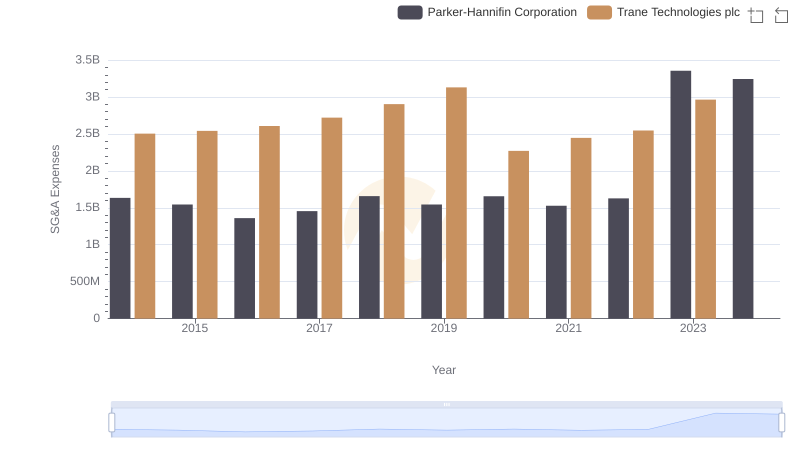
Parker-Hannifin Corporation vs Trane Technologies plc: SG&A Expense Trends
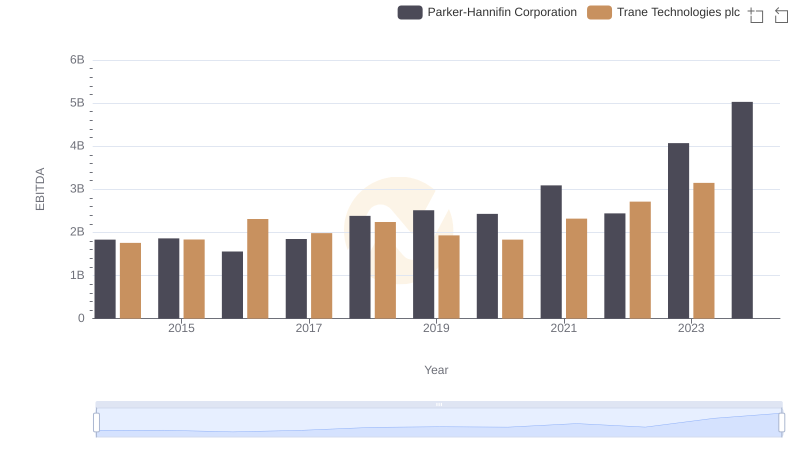
EBITDA Analysis: Evaluating Parker-Hannifin Corporation Against Trane Technologies plc