| __timestamp | Parker-Hannifin Corporation | Trane Technologies plc |
|---|---|---|
| Wednesday, January 1, 2014 | 3027744000 | 3908600000 |
| Thursday, January 1, 2015 | 3056499000 | 3999100000 |
| Friday, January 1, 2016 | 2537369000 | 4179600000 |
| Sunday, January 1, 2017 | 2840350000 | 4386000000 |
| Monday, January 1, 2018 | 3539551000 | 4820600000 |
| Tuesday, January 1, 2019 | 3616840000 | 5147400000 |
| Wednesday, January 1, 2020 | 3409002000 | 3803400000 |
| Friday, January 1, 2021 | 3897960000 | 4469600000 |
| Saturday, January 1, 2022 | 4474341000 | 4964800000 |
| Sunday, January 1, 2023 | 6429302000 | 5857200000 |
| Monday, January 1, 2024 | 7127790000 | 7080500000 |
Unleashing the power of data
In the competitive landscape of industrial manufacturing, Parker-Hannifin Corporation and Trane Technologies plc have shown remarkable growth in gross profit over the past decade. From 2014 to 2023, Parker-Hannifin's gross profit surged by approximately 135%, peaking in 2023. This growth reflects the company's strategic innovations and market expansion. Meanwhile, Trane Technologies experienced a steady increase of around 50% in the same period, highlighting its resilience and adaptability in a dynamic market.
The data for 2024 is incomplete, suggesting potential for further analysis as new information becomes available.
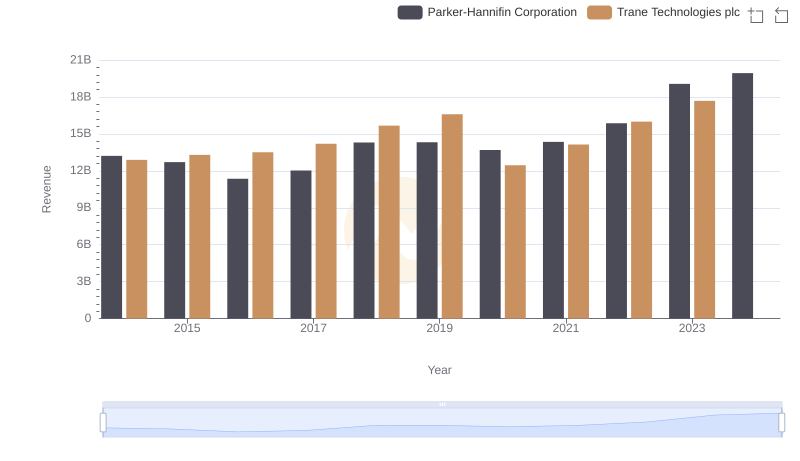
Breaking Down Revenue Trends: Parker-Hannifin Corporation vs Trane Technologies plc
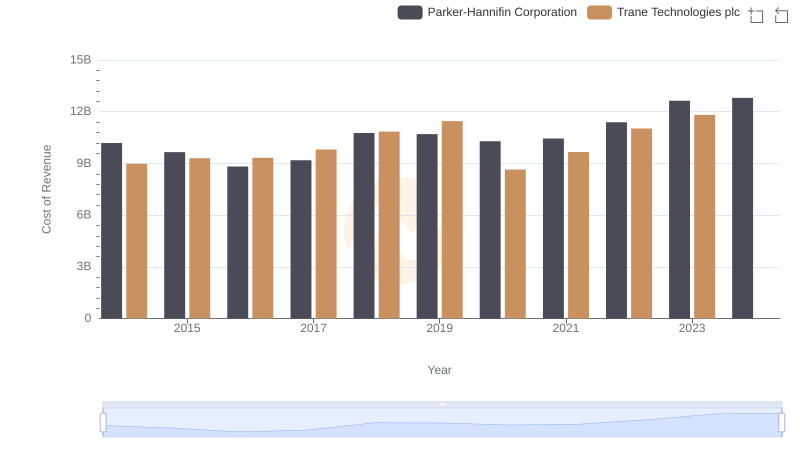
Cost Insights: Breaking Down Parker-Hannifin Corporation and Trane Technologies plc's Expenses

Key Insights on Gross Profit: Parker-Hannifin Corporation vs TransDigm Group Incorporated
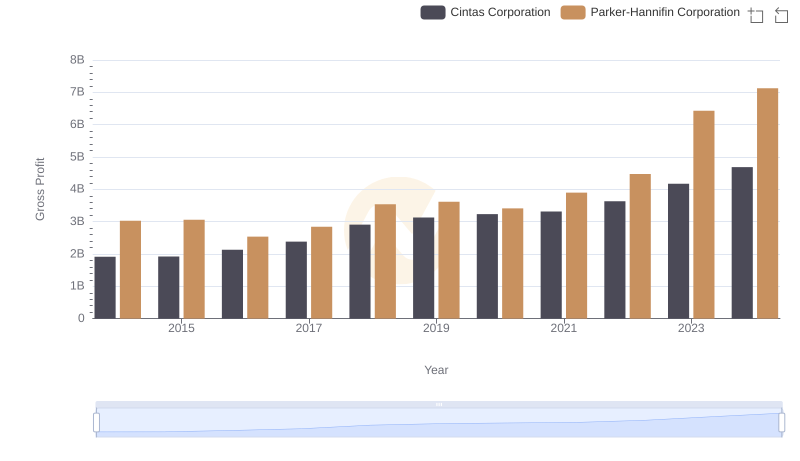
Parker-Hannifin Corporation vs Cintas Corporation: A Gross Profit Performance Breakdown
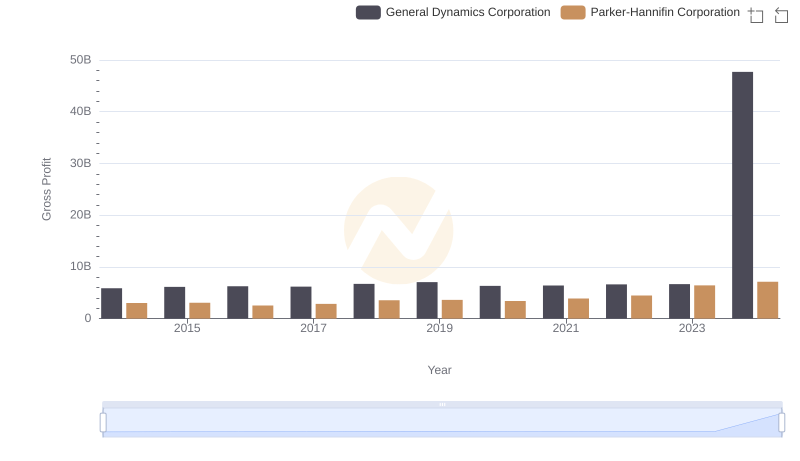
Parker-Hannifin Corporation vs General Dynamics Corporation: A Gross Profit Performance Breakdown
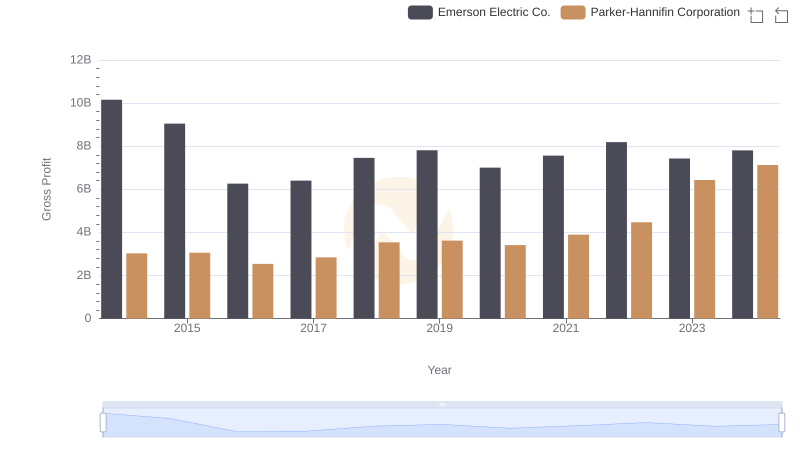
Gross Profit Trends Compared: Parker-Hannifin Corporation vs Emerson Electric Co.
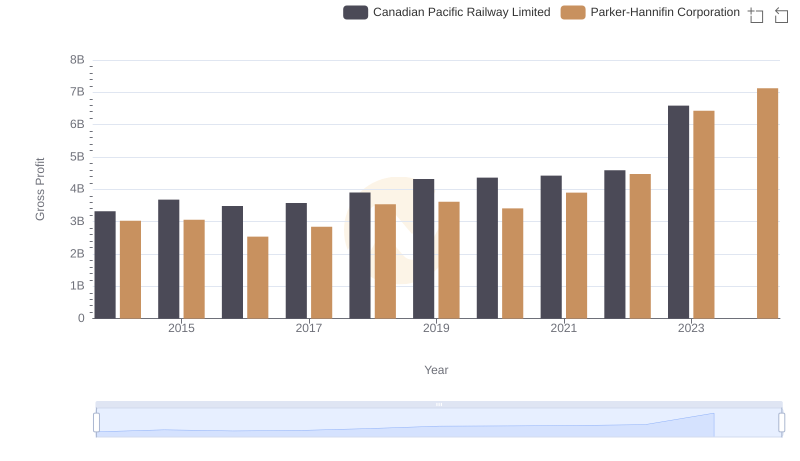
Parker-Hannifin Corporation and Canadian Pacific Railway Limited: A Detailed Gross Profit Analysis
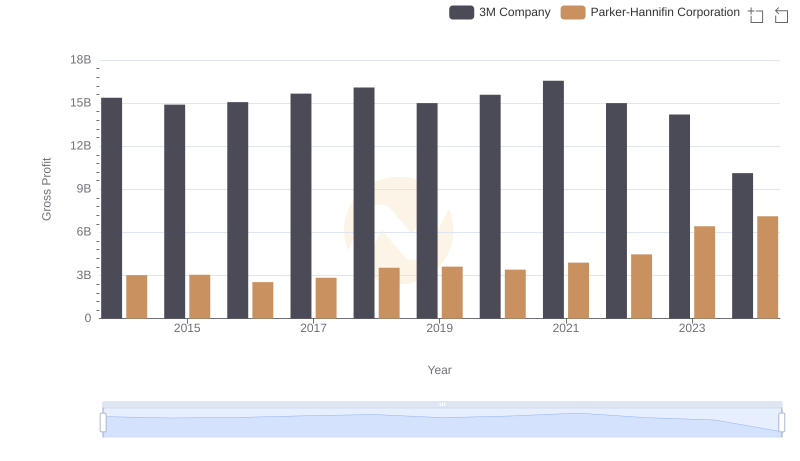
Parker-Hannifin Corporation and 3M Company: A Detailed Gross Profit Analysis
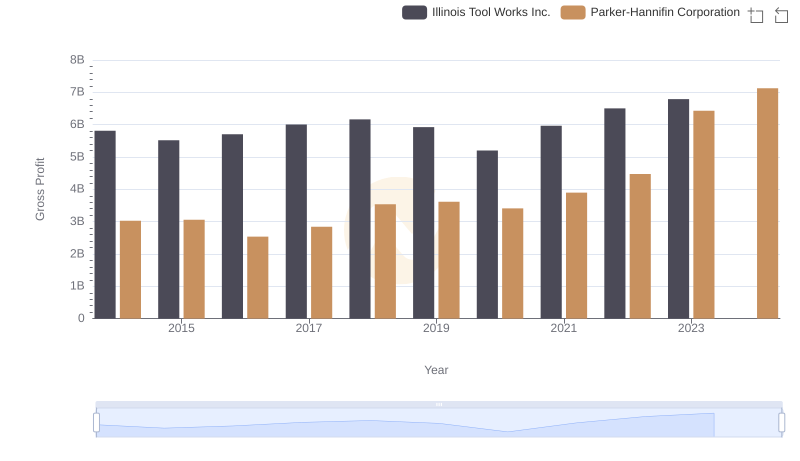
Parker-Hannifin Corporation vs Illinois Tool Works Inc.: A Gross Profit Performance Breakdown
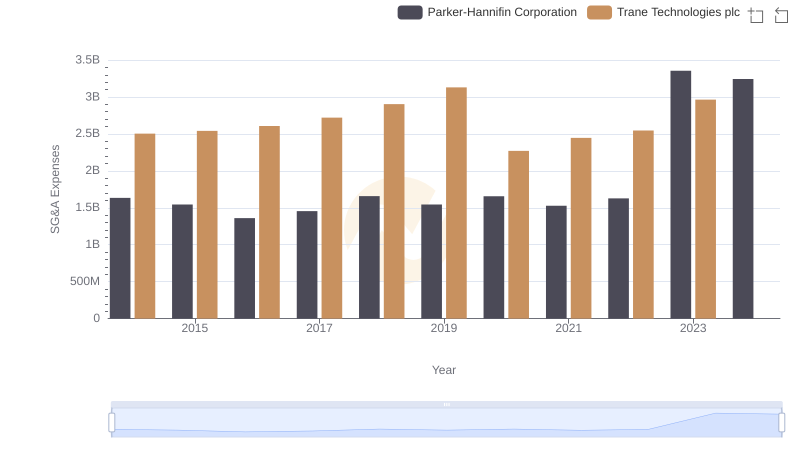
Parker-Hannifin Corporation vs Trane Technologies plc: SG&A Expense Trends
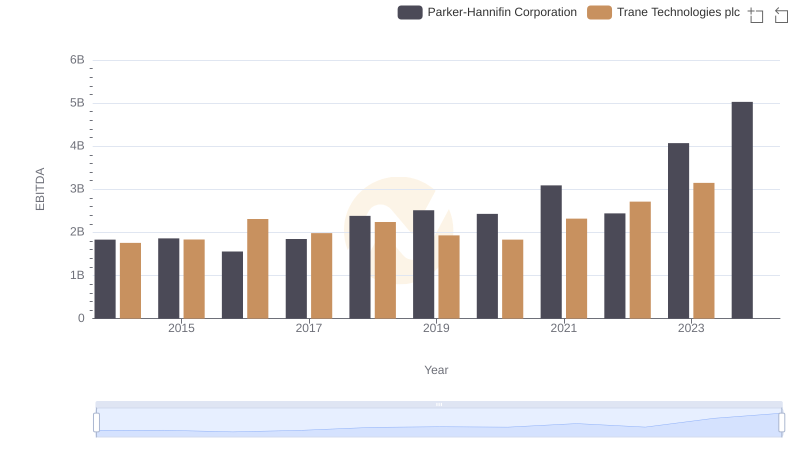
EBITDA Analysis: Evaluating Parker-Hannifin Corporation Against Trane Technologies plc