| __timestamp | Parker-Hannifin Corporation | Trane Technologies plc |
|---|---|---|
| Wednesday, January 1, 2014 | 10188227000 | 8982800000 |
| Thursday, January 1, 2015 | 9655245000 | 9301600000 |
| Friday, January 1, 2016 | 8823384000 | 9329300000 |
| Sunday, January 1, 2017 | 9188962000 | 9811600000 |
| Monday, January 1, 2018 | 10762841000 | 10847600000 |
| Tuesday, January 1, 2019 | 10703484000 | 11451500000 |
| Wednesday, January 1, 2020 | 10286518000 | 8651300000 |
| Friday, January 1, 2021 | 10449680000 | 9666800000 |
| Saturday, January 1, 2022 | 11387267000 | 11026900000 |
| Sunday, January 1, 2023 | 12635892000 | 11820400000 |
| Monday, January 1, 2024 | 12801816000 | 12757700000 |
Unlocking the unknown
In the ever-evolving industrial landscape, understanding cost structures is pivotal. Parker-Hannifin Corporation and Trane Technologies plc, two giants in the sector, offer intriguing insights into their financial strategies over the past decade. From 2014 to 2023, Parker-Hannifin's cost of revenue has shown a steady increase, peaking at approximately $12.6 billion in 2023, marking a 24% rise from 2014. Meanwhile, Trane Technologies experienced a similar upward trend, with costs reaching around $11.8 billion in 2023, a 31% increase from 2014.
Interestingly, 2020 marked a dip for both companies, likely reflecting global economic challenges. However, Parker-Hannifin rebounded strongly, with a 23% increase in costs by 2023. Trane Technologies also recovered, albeit with some data gaps in 2024, indicating potential strategic shifts. This analysis underscores the resilience and adaptability of these industry leaders in navigating financial complexities.
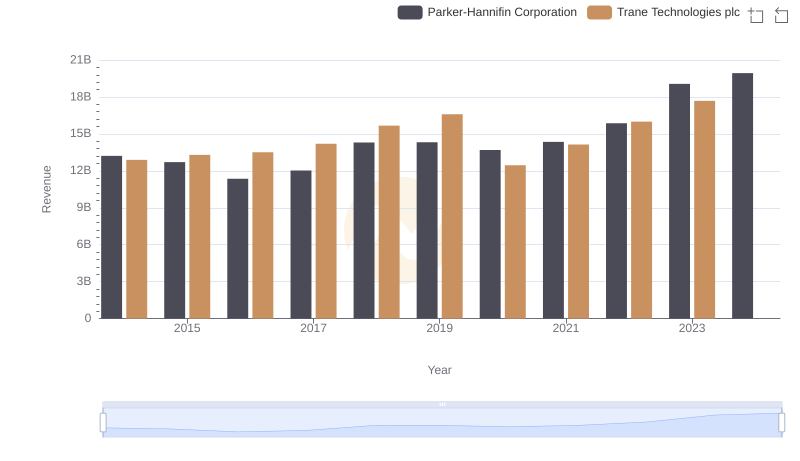
Breaking Down Revenue Trends: Parker-Hannifin Corporation vs Trane Technologies plc
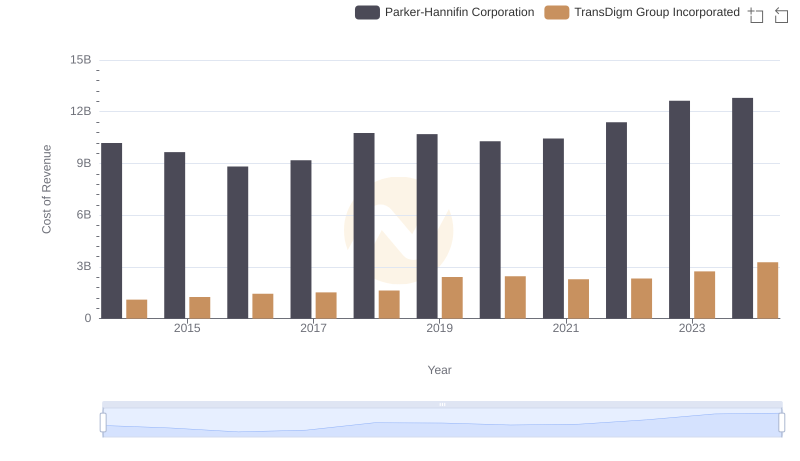
Analyzing Cost of Revenue: Parker-Hannifin Corporation and TransDigm Group Incorporated
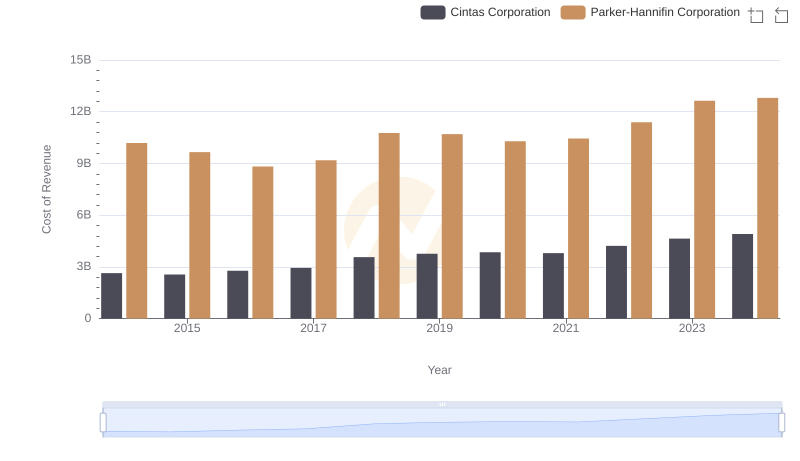
Cost Insights: Breaking Down Parker-Hannifin Corporation and Cintas Corporation's Expenses
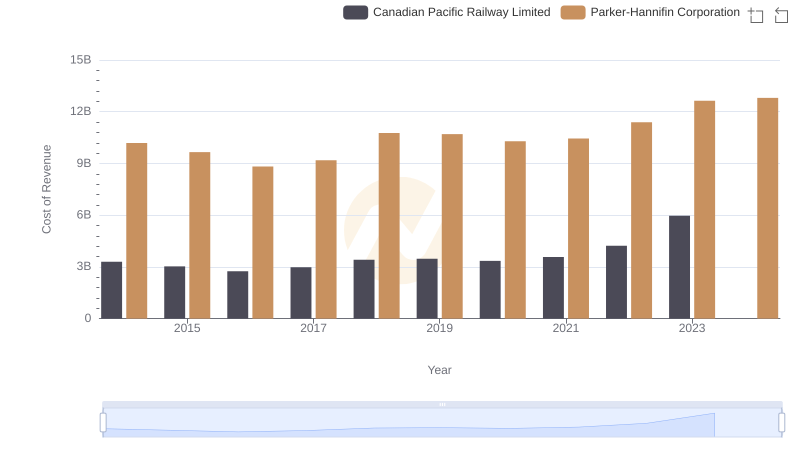
Cost of Revenue Trends: Parker-Hannifin Corporation vs Canadian Pacific Railway Limited
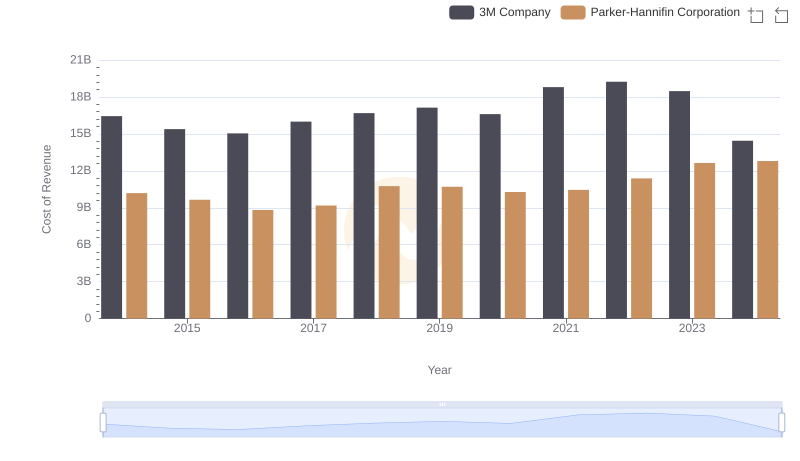
Parker-Hannifin Corporation vs 3M Company: Efficiency in Cost of Revenue Explored

Cost of Revenue Trends: Parker-Hannifin Corporation vs Illinois Tool Works Inc.
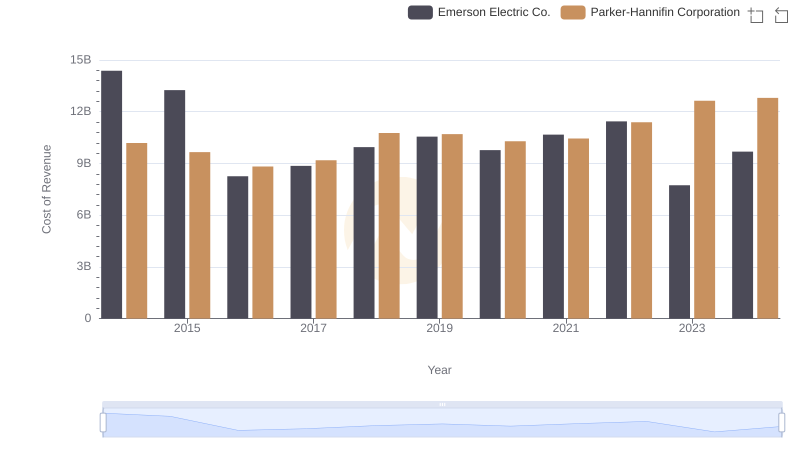
Comparing Cost of Revenue Efficiency: Parker-Hannifin Corporation vs Emerson Electric Co.
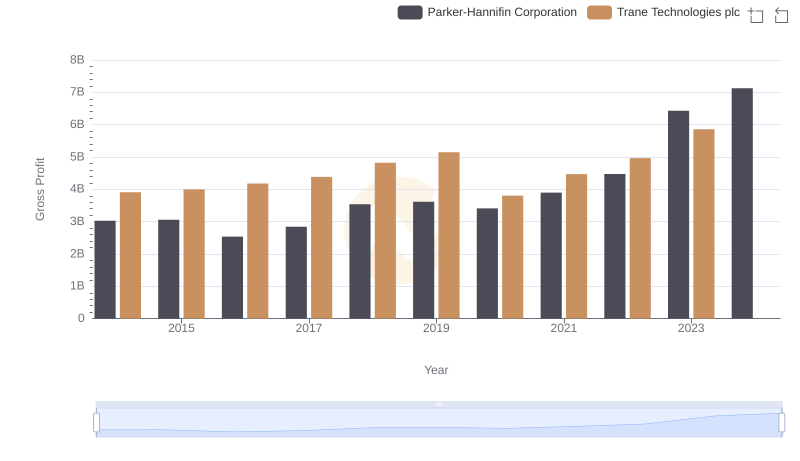
Gross Profit Analysis: Comparing Parker-Hannifin Corporation and Trane Technologies plc
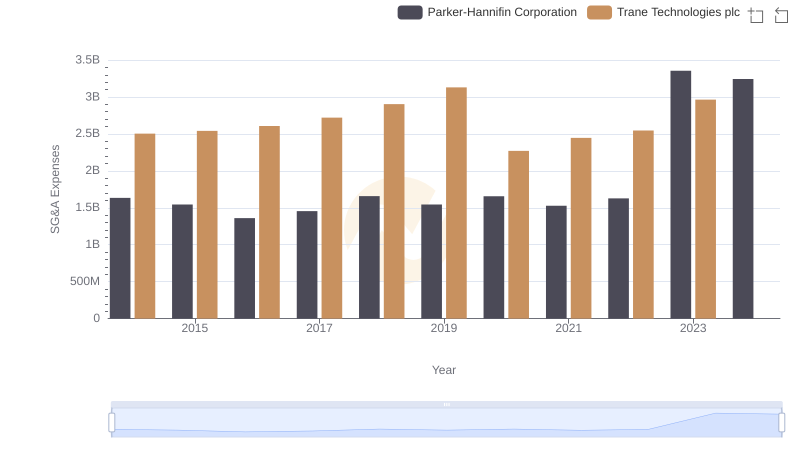
Parker-Hannifin Corporation vs Trane Technologies plc: SG&A Expense Trends
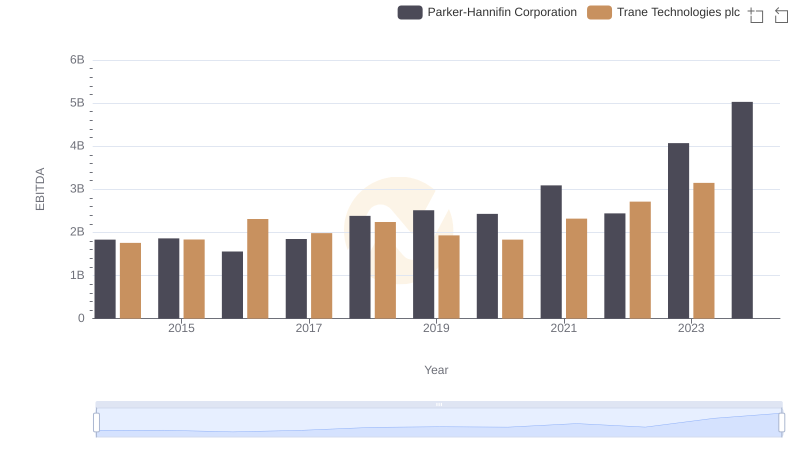
EBITDA Analysis: Evaluating Parker-Hannifin Corporation Against Trane Technologies plc