| __timestamp | Parker-Hannifin Corporation | TransDigm Group Incorporated |
|---|---|---|
| Wednesday, January 1, 2014 | 1633992000 | 276446000 |
| Thursday, January 1, 2015 | 1544746000 | 321624000 |
| Friday, January 1, 2016 | 1359360000 | 382858000 |
| Sunday, January 1, 2017 | 1453935000 | 415575000 |
| Monday, January 1, 2018 | 1657152000 | 450095000 |
| Tuesday, January 1, 2019 | 1543939000 | 747773000 |
| Wednesday, January 1, 2020 | 1656553000 | 727000000 |
| Friday, January 1, 2021 | 1527302000 | 685000000 |
| Saturday, January 1, 2022 | 1627116000 | 748000000 |
| Sunday, January 1, 2023 | 3354103000 | 780000000 |
| Monday, January 1, 2024 | 3315177000 | 931000000 |
Unveiling the hidden dimensions of data
In the competitive landscape of industrial manufacturing, Parker-Hannifin Corporation and TransDigm Group Incorporated stand as titans. Over the past decade, Parker-Hannifin has consistently outpaced TransDigm in terms of Selling, General, and Administrative (SG&A) expenses, with figures peaking at over 3.3 billion in 2023. This represents a staggering 105% increase from 2014. In contrast, TransDigm's SG&A expenses have shown a more modest growth, reaching approximately 931 million in 2024, marking a 237% increase since 2014.
From 2014 to 2024, Parker-Hannifin's SG&A expenses have fluctuated, reflecting strategic shifts and market dynamics. Meanwhile, TransDigm's steady rise in expenses suggests a more consistent approach to operational efficiency. This analysis offers a window into the financial strategies of these industry leaders, highlighting the diverse paths to success in the ever-evolving industrial sector.

Who Generates More Revenue? Parker-Hannifin Corporation or TransDigm Group Incorporated
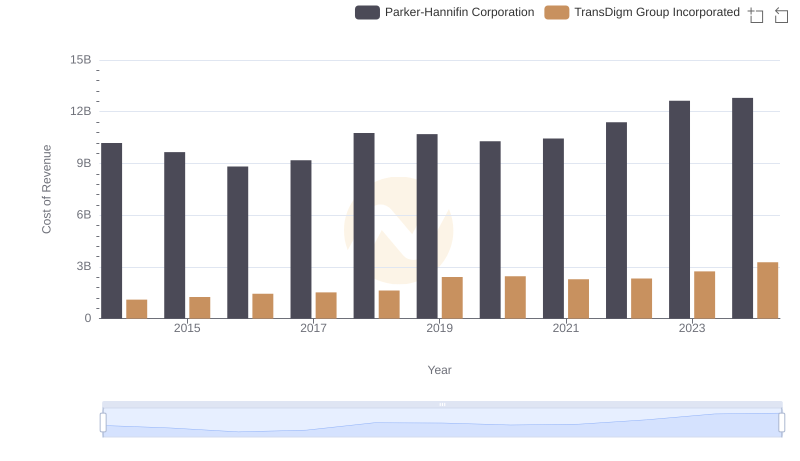
Analyzing Cost of Revenue: Parker-Hannifin Corporation and TransDigm Group Incorporated

Key Insights on Gross Profit: Parker-Hannifin Corporation vs TransDigm Group Incorporated
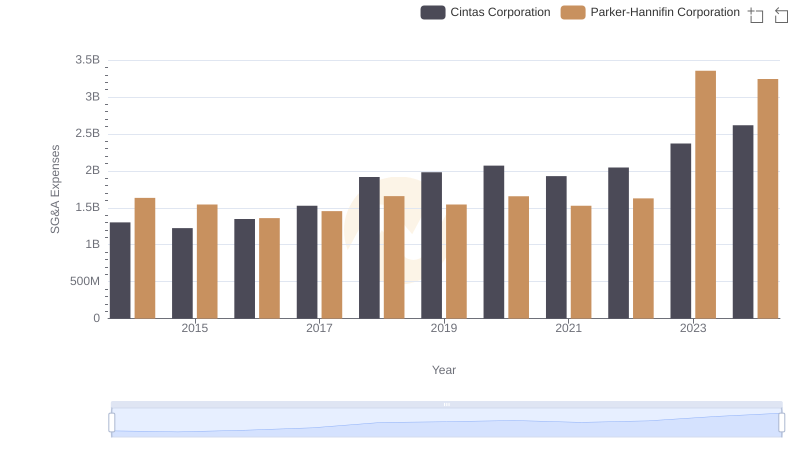
Parker-Hannifin Corporation and Cintas Corporation: SG&A Spending Patterns Compared
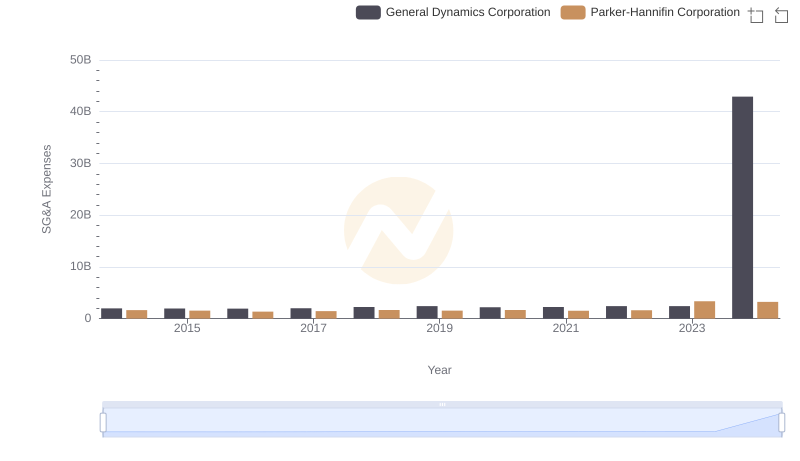
Operational Costs Compared: SG&A Analysis of Parker-Hannifin Corporation and General Dynamics Corporation
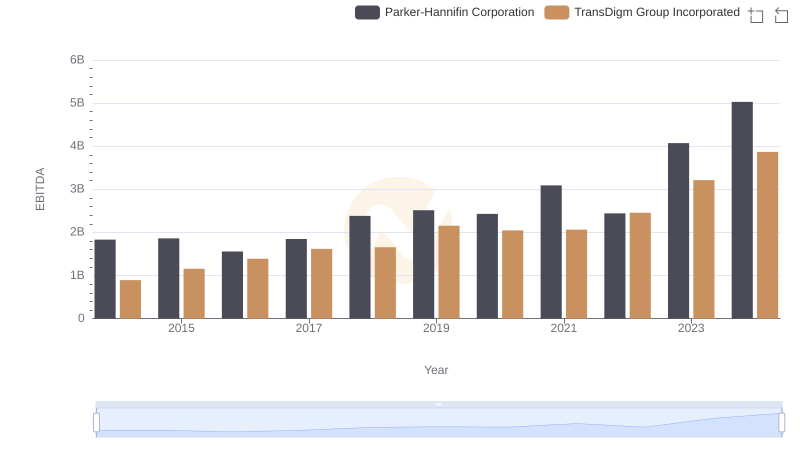
A Professional Review of EBITDA: Parker-Hannifin Corporation Compared to TransDigm Group Incorporated
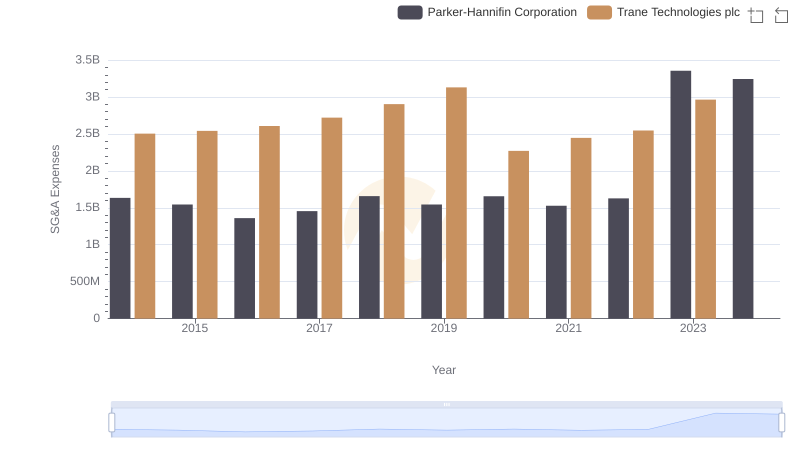
Parker-Hannifin Corporation vs Trane Technologies plc: SG&A Expense Trends
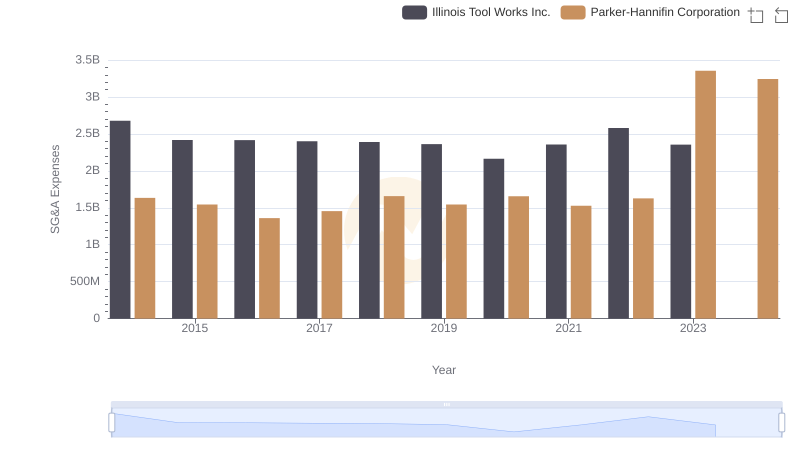
Breaking Down SG&A Expenses: Parker-Hannifin Corporation vs Illinois Tool Works Inc.
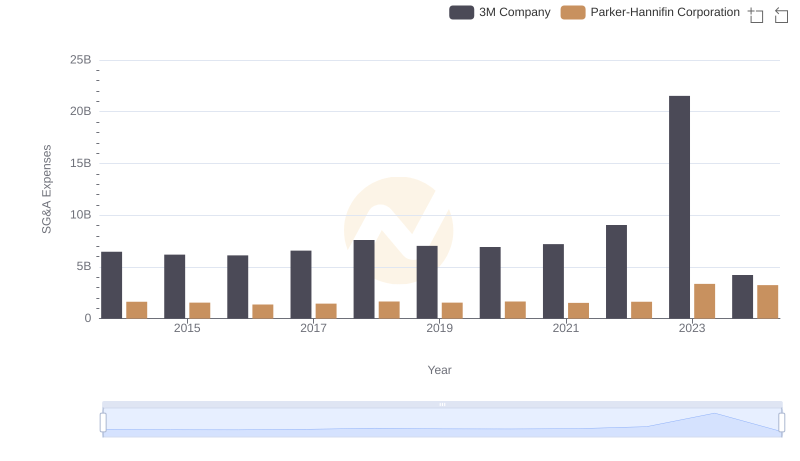
Parker-Hannifin Corporation and 3M Company: SG&A Spending Patterns Compared
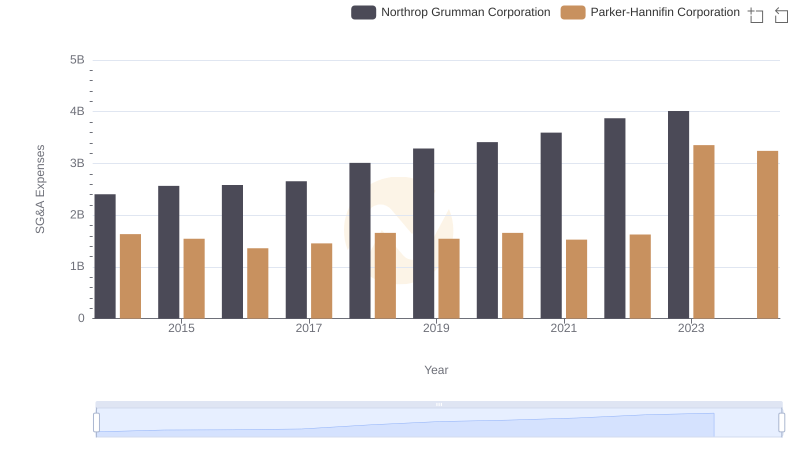
SG&A Efficiency Analysis: Comparing Parker-Hannifin Corporation and Northrop Grumman Corporation