| __timestamp | 3M Company | Parker-Hannifin Corporation |
|---|---|---|
| Wednesday, January 1, 2014 | 6469000000 | 1633992000 |
| Thursday, January 1, 2015 | 6182000000 | 1544746000 |
| Friday, January 1, 2016 | 6111000000 | 1359360000 |
| Sunday, January 1, 2017 | 6572000000 | 1453935000 |
| Monday, January 1, 2018 | 7602000000 | 1657152000 |
| Tuesday, January 1, 2019 | 7029000000 | 1543939000 |
| Wednesday, January 1, 2020 | 6929000000 | 1656553000 |
| Friday, January 1, 2021 | 7197000000 | 1527302000 |
| Saturday, January 1, 2022 | 9049000000 | 1627116000 |
| Sunday, January 1, 2023 | 21526000000 | 3354103000 |
| Monday, January 1, 2024 | 4221000000 | 3315177000 |
Unleashing insights
In the world of industrial giants, Parker-Hannifin Corporation and 3M Company have long been stalwarts of innovation and efficiency. Over the past decade, their spending on Selling, General, and Administrative (SG&A) expenses has revealed intriguing patterns. From 2014 to 2023, 3M's SG&A expenses have fluctuated, peaking dramatically in 2023 with a 138% increase compared to 2014. In contrast, Parker-Hannifin's SG&A expenses have shown a more stable trajectory, with a notable 105% increase in 2023 compared to 2014. This divergence highlights 3M's aggressive expansion strategies, while Parker-Hannifin maintains a steady course. As we look to 2024, 3M's expenses drop significantly, suggesting a strategic recalibration. These trends offer a window into the operational philosophies of these two industrial titans, providing valuable insights for investors and industry analysts alike.
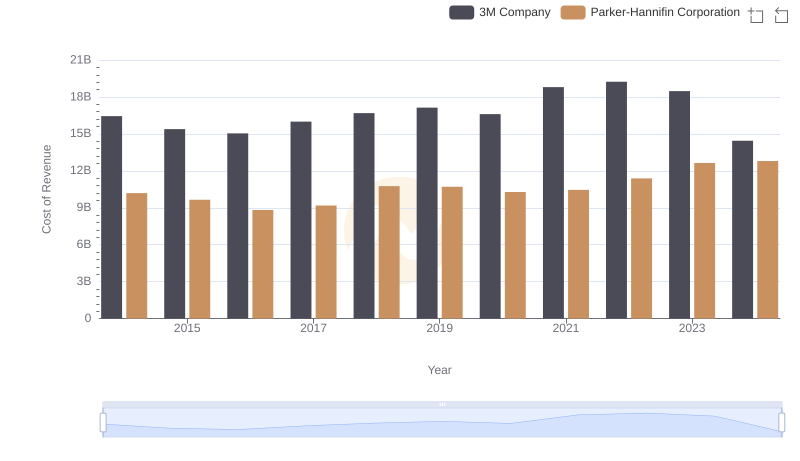
Parker-Hannifin Corporation vs 3M Company: Efficiency in Cost of Revenue Explored
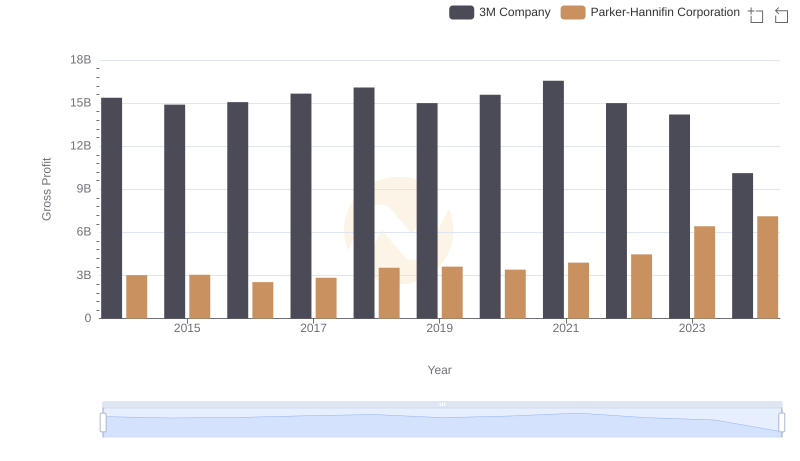
Parker-Hannifin Corporation and 3M Company: A Detailed Gross Profit Analysis
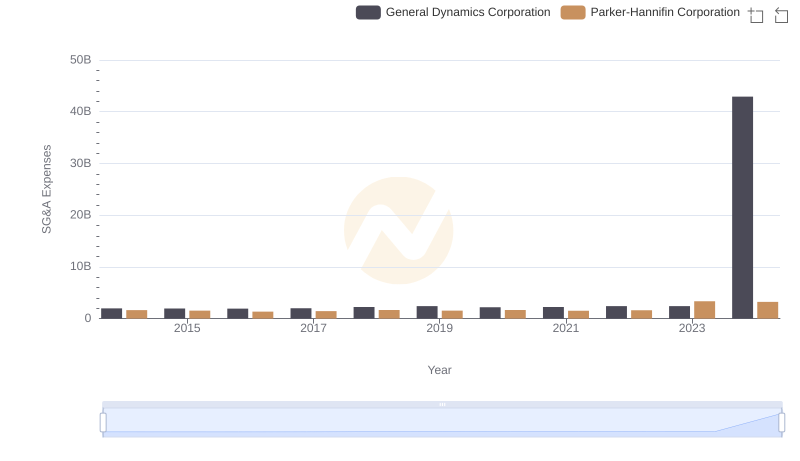
Operational Costs Compared: SG&A Analysis of Parker-Hannifin Corporation and General Dynamics Corporation
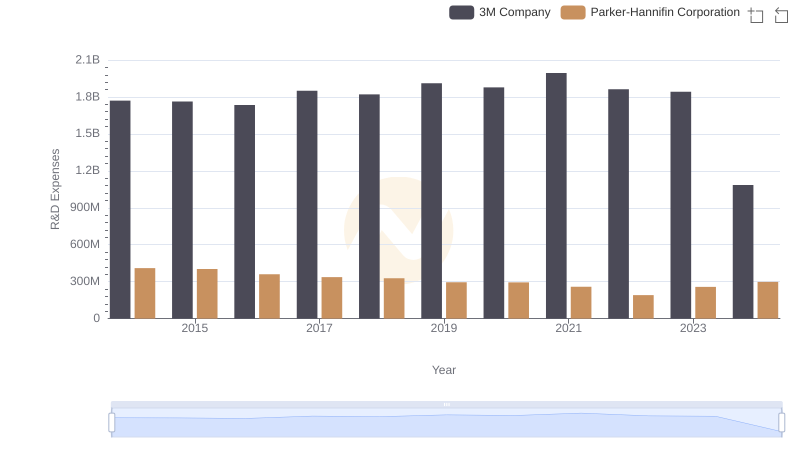
Parker-Hannifin Corporation or 3M Company: Who Invests More in Innovation?
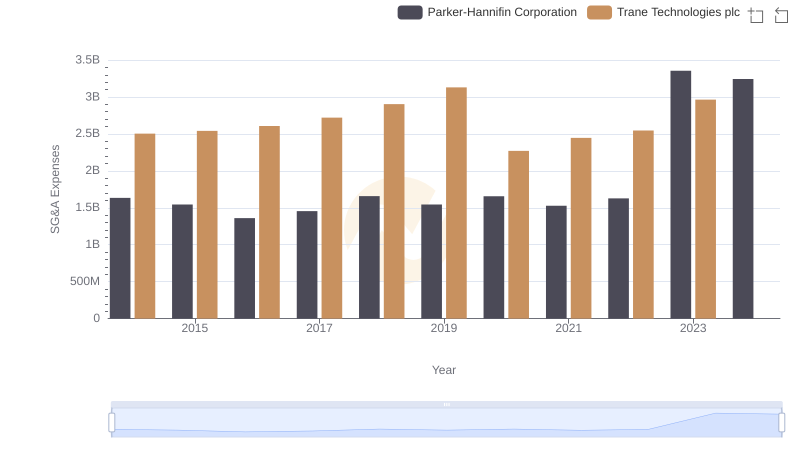
Parker-Hannifin Corporation vs Trane Technologies plc: SG&A Expense Trends
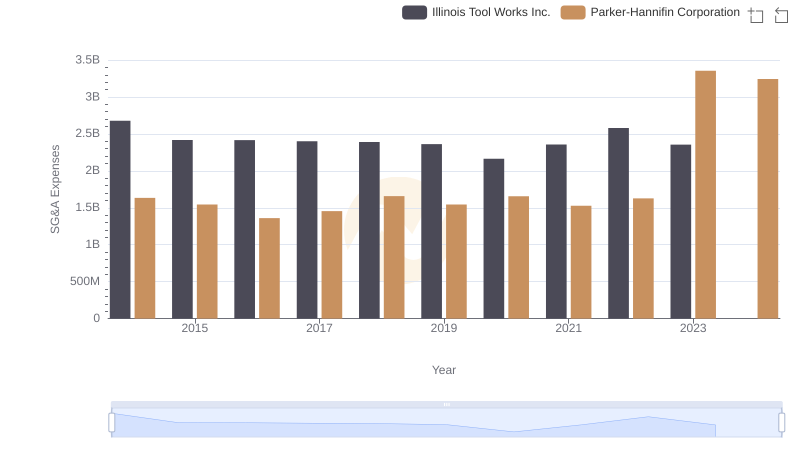
Breaking Down SG&A Expenses: Parker-Hannifin Corporation vs Illinois Tool Works Inc.
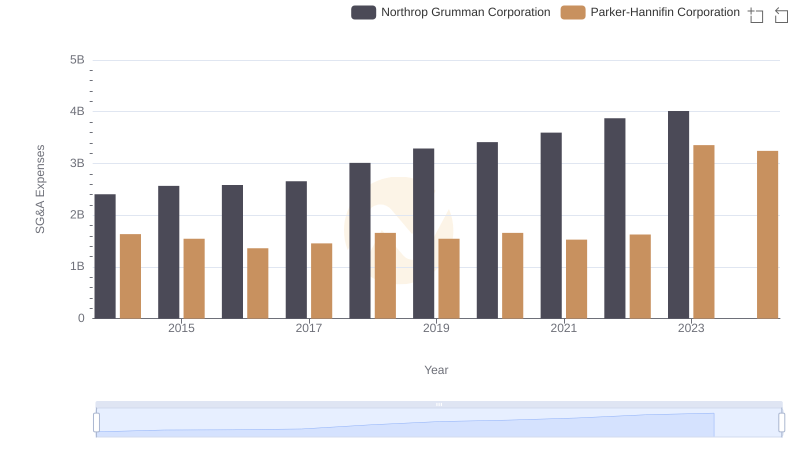
SG&A Efficiency Analysis: Comparing Parker-Hannifin Corporation and Northrop Grumman Corporation
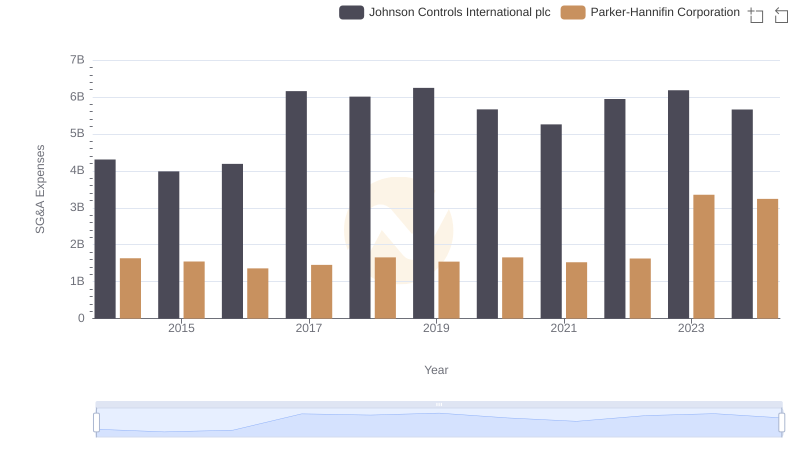
Parker-Hannifin Corporation or Johnson Controls International plc: Who Manages SG&A Costs Better?