| __timestamp | HEICO Corporation | Parker-Hannifin Corporation |
|---|---|---|
| Wednesday, January 1, 2014 | 398312000 | 3027744000 |
| Thursday, January 1, 2015 | 434179000 | 3056499000 |
| Friday, January 1, 2016 | 515492000 | 2537369000 |
| Sunday, January 1, 2017 | 574725000 | 2840350000 |
| Monday, January 1, 2018 | 690715000 | 3539551000 |
| Tuesday, January 1, 2019 | 813840000 | 3616840000 |
| Wednesday, January 1, 2020 | 682127000 | 3409002000 |
| Friday, January 1, 2021 | 727423000 | 3897960000 |
| Saturday, January 1, 2022 | 862759000 | 4474341000 |
| Sunday, January 1, 2023 | 1153488000 | 6429302000 |
| Monday, January 1, 2024 | 1501726000 | 7127790000 |
Unleashing insights
In the competitive landscape of industrial manufacturing, Parker-Hannifin Corporation and HEICO Corporation have emerged as formidable players. Over the past decade, Parker-Hannifin has consistently outperformed HEICO in terms of gross profit, showcasing a robust growth trajectory. From 2014 to 2024, Parker-Hannifin's gross profit surged by approximately 135%, reaching a peak in 2024. In contrast, HEICO's gross profit, while impressive, grew by about 277% over the same period, indicating a strong upward trend.
This analysis underscores the dynamic nature of the industrial sector, where strategic innovation and market adaptation are key to sustained success.
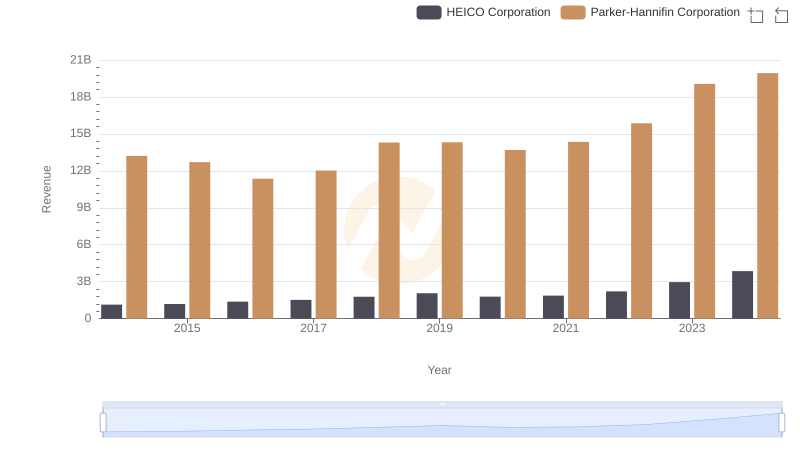
Comparing Revenue Performance: Parker-Hannifin Corporation or HEICO Corporation?

Who Generates Higher Gross Profit? Parker-Hannifin Corporation or Westinghouse Air Brake Technologies Corporation
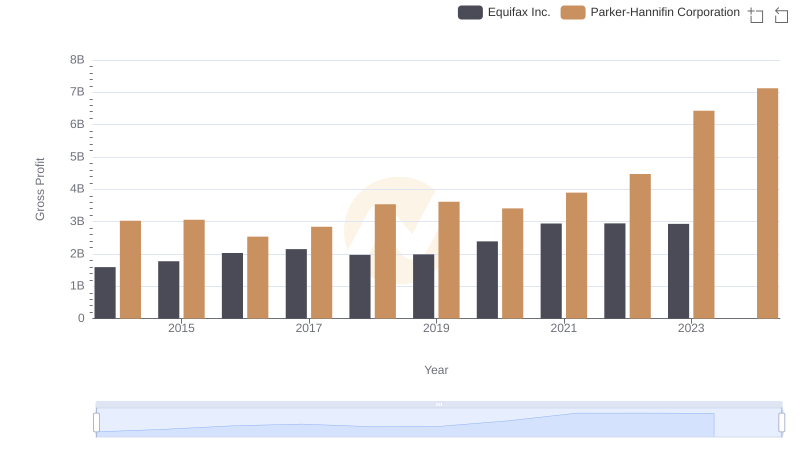
Parker-Hannifin Corporation and Equifax Inc.: A Detailed Gross Profit Analysis
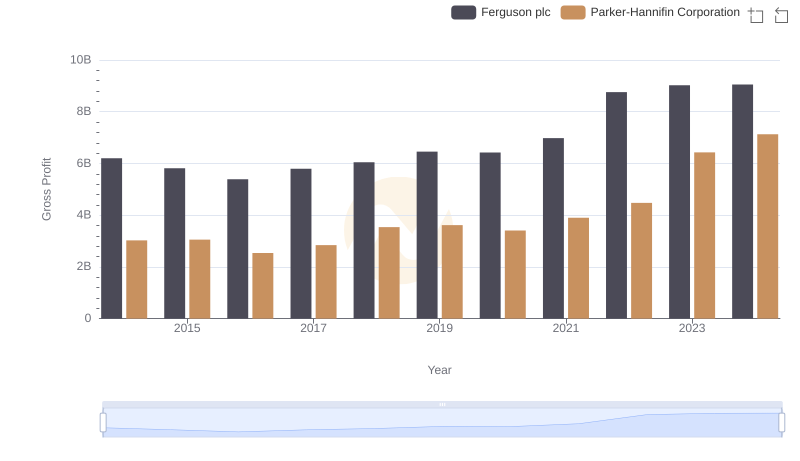
Gross Profit Comparison: Parker-Hannifin Corporation and Ferguson plc Trends
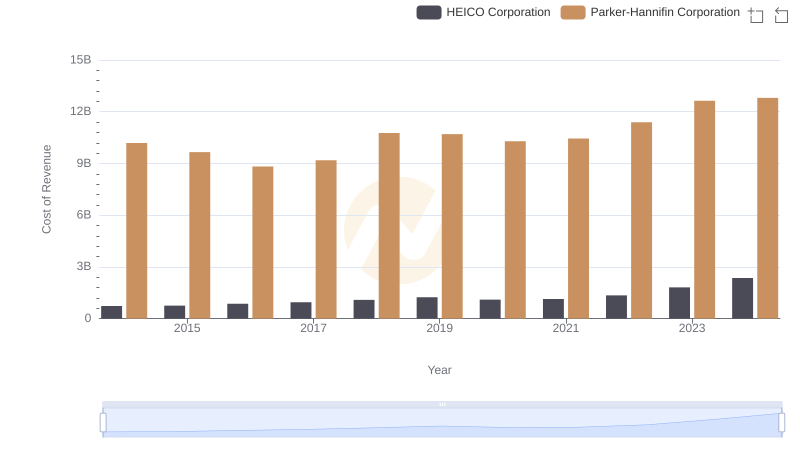
Cost of Revenue Comparison: Parker-Hannifin Corporation vs HEICO Corporation
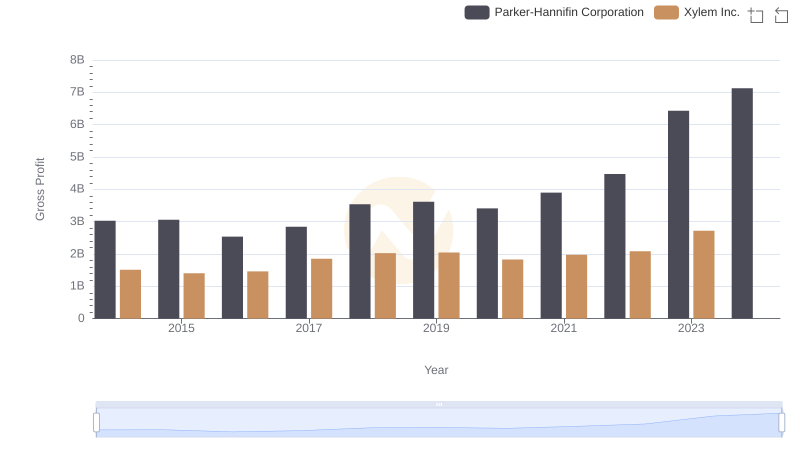
Gross Profit Analysis: Comparing Parker-Hannifin Corporation and Xylem Inc.
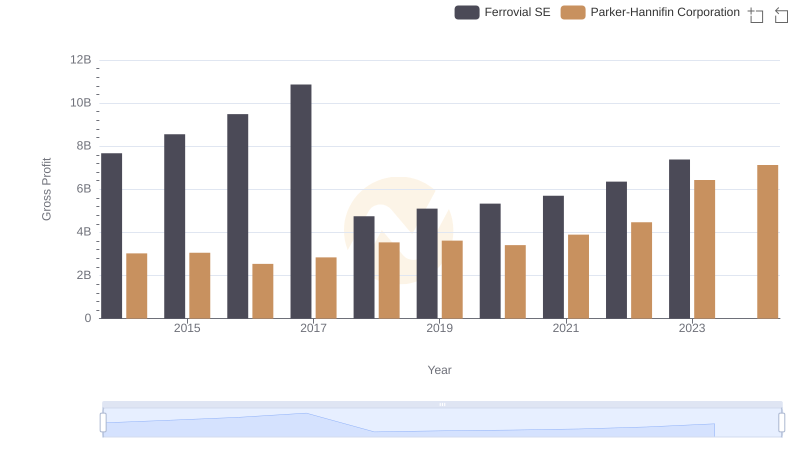
Parker-Hannifin Corporation and Ferrovial SE: A Detailed Gross Profit Analysis
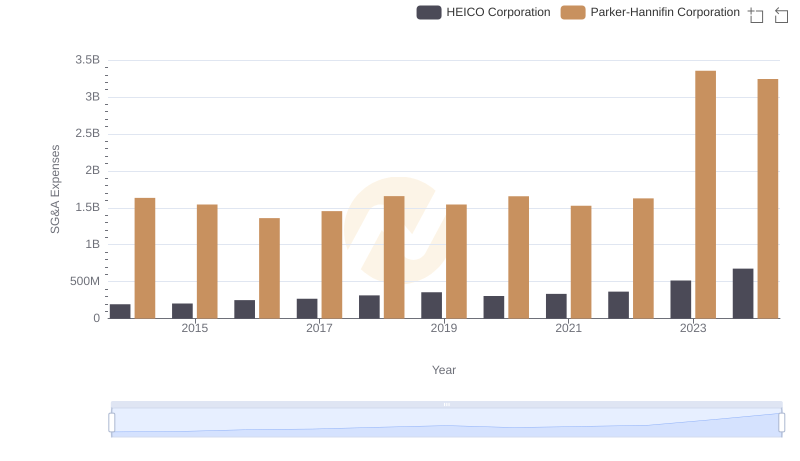
Breaking Down SG&A Expenses: Parker-Hannifin Corporation vs HEICO Corporation
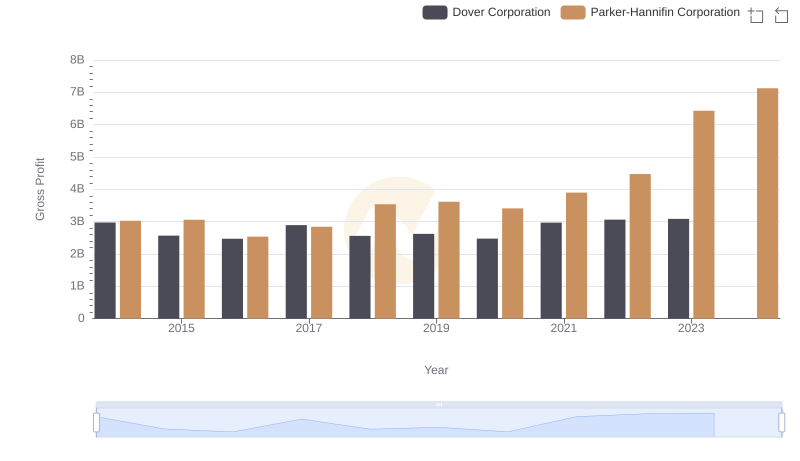
Gross Profit Comparison: Parker-Hannifin Corporation and Dover Corporation Trends
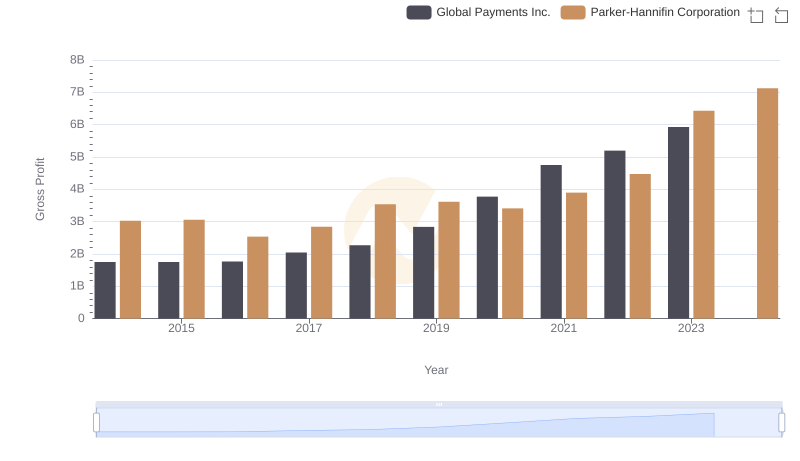
Gross Profit Comparison: Parker-Hannifin Corporation and Global Payments Inc. Trends
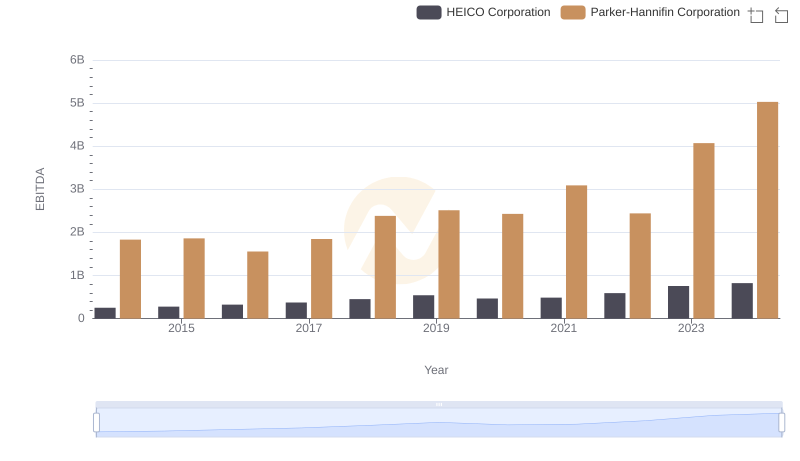
Comprehensive EBITDA Comparison: Parker-Hannifin Corporation vs HEICO Corporation