| __timestamp | HEICO Corporation | Parker-Hannifin Corporation |
|---|---|---|
| Wednesday, January 1, 2014 | 1132311000 | 13215971000 |
| Thursday, January 1, 2015 | 1188648000 | 12711744000 |
| Friday, January 1, 2016 | 1376258000 | 11360753000 |
| Sunday, January 1, 2017 | 1524813000 | 12029312000 |
| Monday, January 1, 2018 | 1777721000 | 14302392000 |
| Tuesday, January 1, 2019 | 2055647000 | 14320324000 |
| Wednesday, January 1, 2020 | 1787009000 | 13695520000 |
| Friday, January 1, 2021 | 1865682000 | 14347640000 |
| Saturday, January 1, 2022 | 2208322000 | 15861608000 |
| Sunday, January 1, 2023 | 2968105000 | 19065194000 |
| Monday, January 1, 2024 | 3857669000 | 19929606000 |
Unlocking the unknown
In the competitive landscape of industrial manufacturing, Parker-Hannifin Corporation and HEICO Corporation have emerged as formidable players. Over the past decade, Parker-Hannifin has consistently outperformed HEICO in terms of revenue, boasting figures that are approximately 7 times higher on average. In 2023, Parker-Hannifin's revenue surged to nearly $19 billion, marking a 20% increase from 2022. Meanwhile, HEICO's revenue also saw a significant rise, reaching close to $3 billion, a 34% jump from the previous year.
From 2014 to 2024, Parker-Hannifin's revenue trajectory has been upward, with a notable peak in 2024 at nearly $20 billion. HEICO, while smaller in scale, has demonstrated impressive growth, particularly in recent years, with a remarkable 70% increase from 2014 to 2024. This data underscores the dynamic nature of the industrial sector and the potential for growth within it.
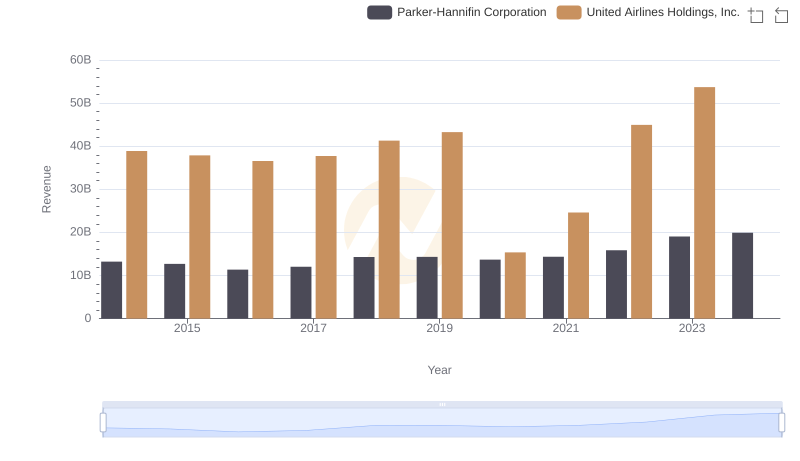
Comparing Revenue Performance: Parker-Hannifin Corporation or United Airlines Holdings, Inc.?
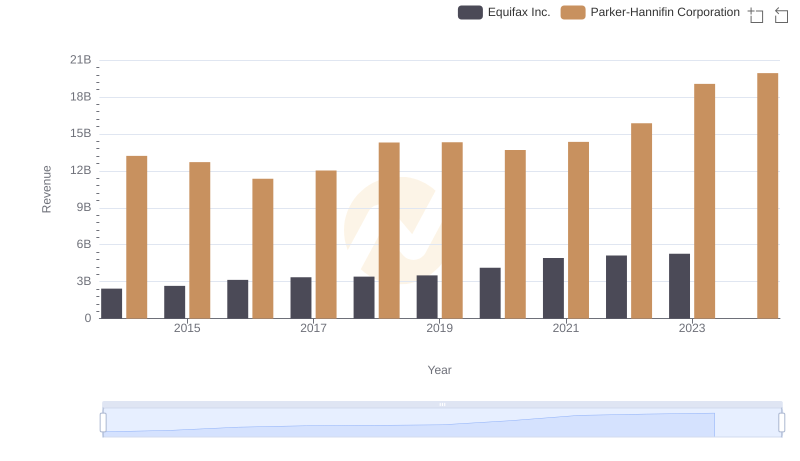
Parker-Hannifin Corporation vs Equifax Inc.: Annual Revenue Growth Compared
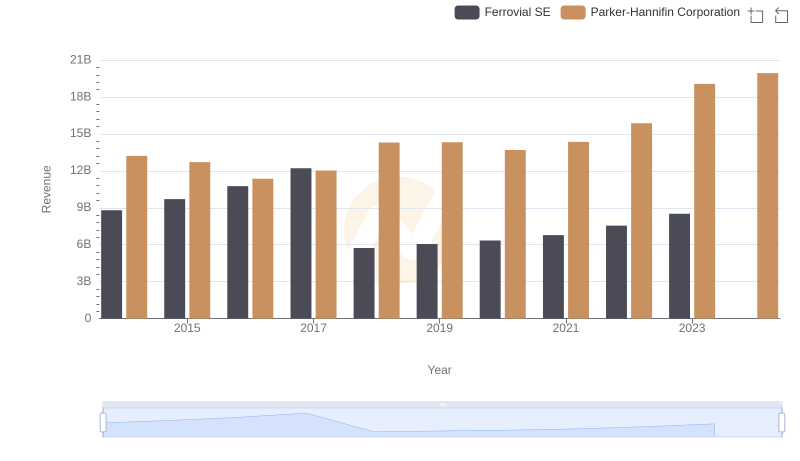
Parker-Hannifin Corporation vs Ferrovial SE: Examining Key Revenue Metrics
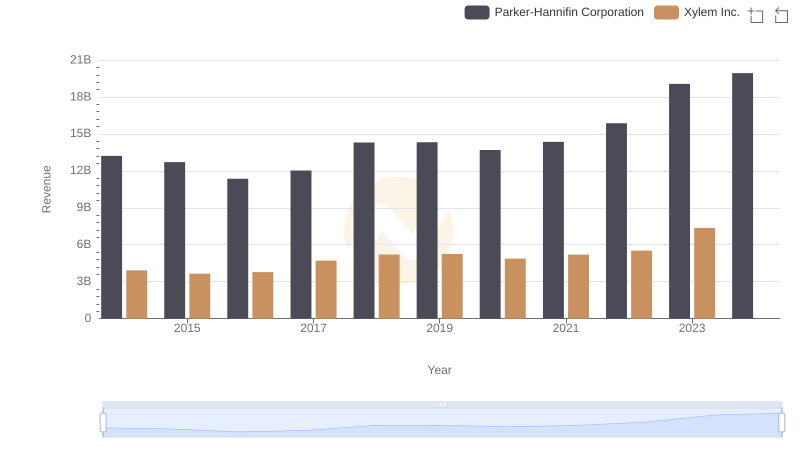
Annual Revenue Comparison: Parker-Hannifin Corporation vs Xylem Inc.
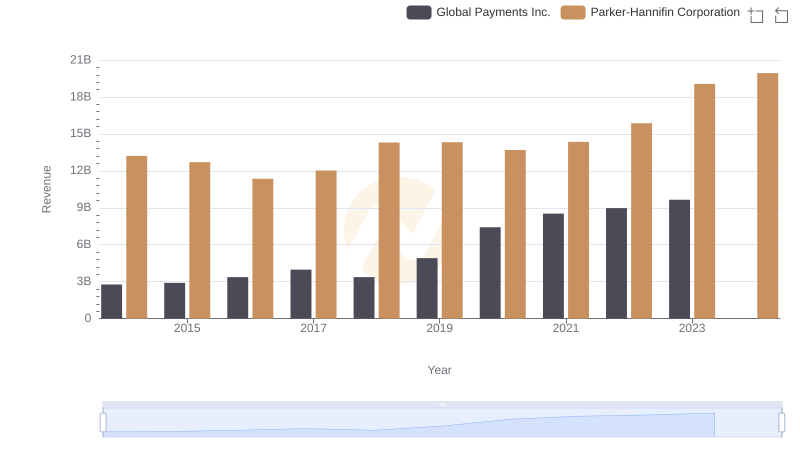
Annual Revenue Comparison: Parker-Hannifin Corporation vs Global Payments Inc.
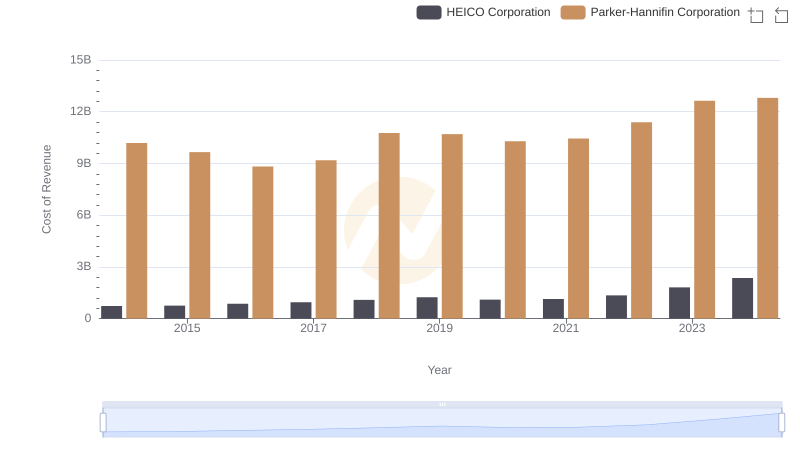
Cost of Revenue Comparison: Parker-Hannifin Corporation vs HEICO Corporation

Who Generates More Revenue? Parker-Hannifin Corporation or Dover Corporation
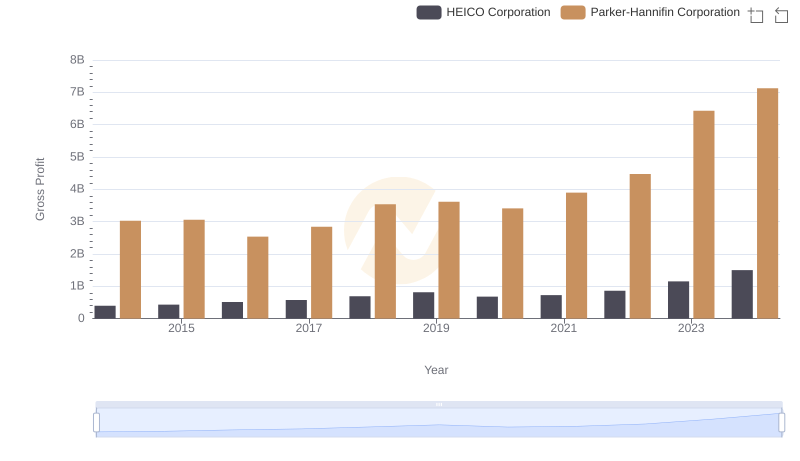
Parker-Hannifin Corporation vs HEICO Corporation: A Gross Profit Performance Breakdown
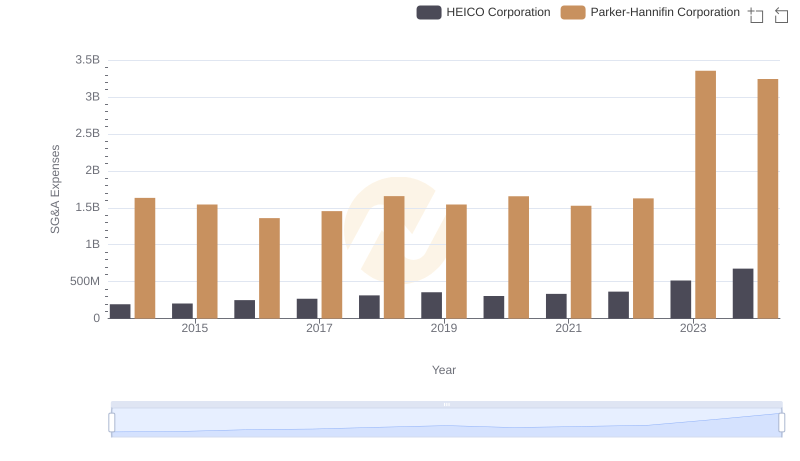
Breaking Down SG&A Expenses: Parker-Hannifin Corporation vs HEICO Corporation
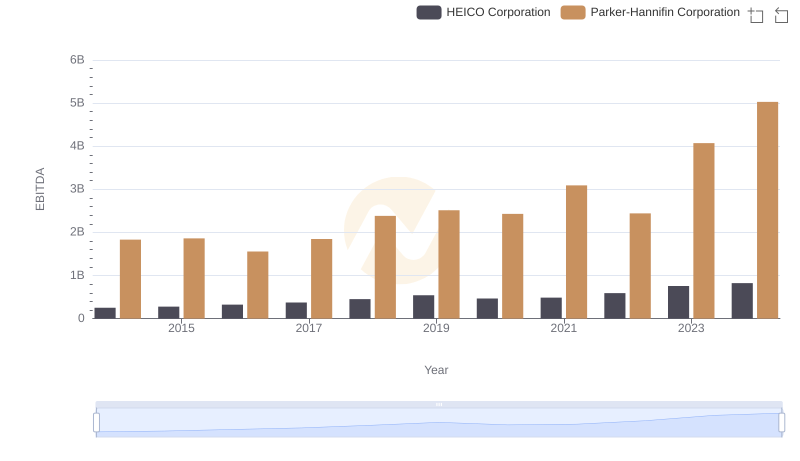
Comprehensive EBITDA Comparison: Parker-Hannifin Corporation vs HEICO Corporation