| __timestamp | Parker-Hannifin Corporation | Xylem Inc. |
|---|---|---|
| Wednesday, January 1, 2014 | 3027744000 | 1513000000 |
| Thursday, January 1, 2015 | 3056499000 | 1404000000 |
| Friday, January 1, 2016 | 2537369000 | 1461000000 |
| Sunday, January 1, 2017 | 2840350000 | 1851000000 |
| Monday, January 1, 2018 | 3539551000 | 2026000000 |
| Tuesday, January 1, 2019 | 3616840000 | 2046000000 |
| Wednesday, January 1, 2020 | 3409002000 | 1830000000 |
| Friday, January 1, 2021 | 3897960000 | 1975000000 |
| Saturday, January 1, 2022 | 4474341000 | 2084000000 |
| Sunday, January 1, 2023 | 6429302000 | 2717000000 |
| Monday, January 1, 2024 | 7127790000 |
Infusing magic into the data realm
In the ever-evolving landscape of industrial manufacturing, Parker-Hannifin Corporation and Xylem Inc. have emerged as key players. Over the past decade, Parker-Hannifin has demonstrated a robust growth trajectory, with its gross profit surging by approximately 135% from 2014 to 2023. This impressive growth is highlighted by a significant leap in 2023, where gross profit reached a peak, marking a 44% increase from the previous year.
Conversely, Xylem Inc. has shown steady, albeit more modest, growth. From 2014 to 2023, Xylem's gross profit increased by around 80%, with a notable uptick in 2023. However, data for 2024 remains unavailable, leaving room for speculation on future trends.
These insights underscore the dynamic nature of the industrial sector, where strategic innovation and market adaptation are key to sustaining growth.
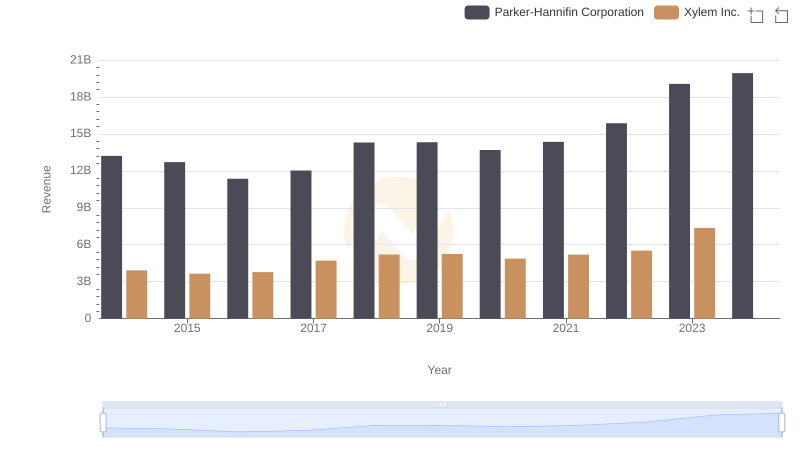
Annual Revenue Comparison: Parker-Hannifin Corporation vs Xylem Inc.

Who Generates Higher Gross Profit? Parker-Hannifin Corporation or Westinghouse Air Brake Technologies Corporation
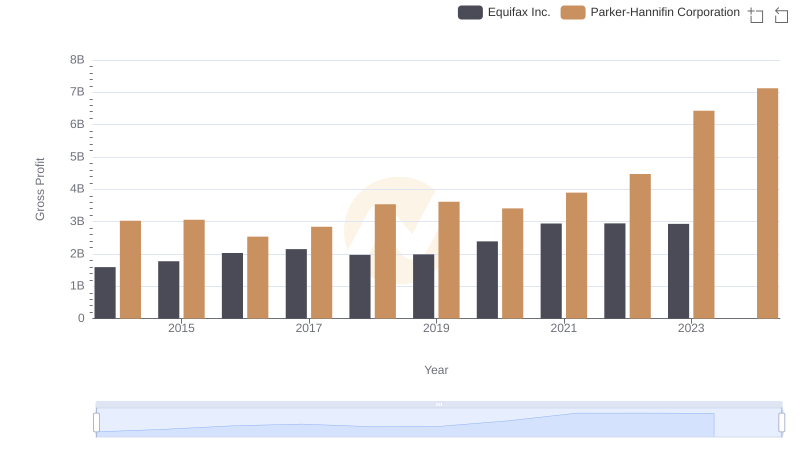
Parker-Hannifin Corporation and Equifax Inc.: A Detailed Gross Profit Analysis
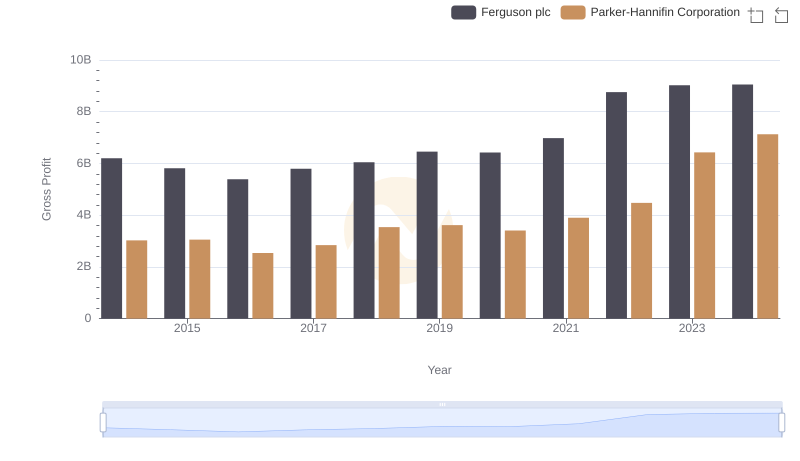
Gross Profit Comparison: Parker-Hannifin Corporation and Ferguson plc Trends
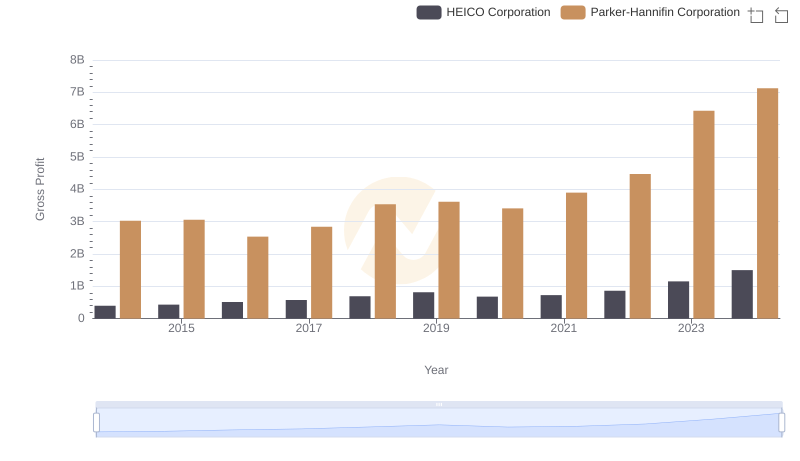
Parker-Hannifin Corporation vs HEICO Corporation: A Gross Profit Performance Breakdown
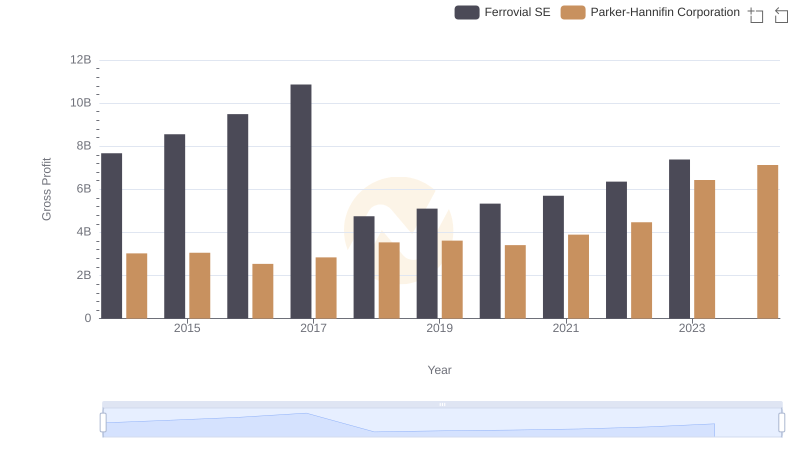
Parker-Hannifin Corporation and Ferrovial SE: A Detailed Gross Profit Analysis
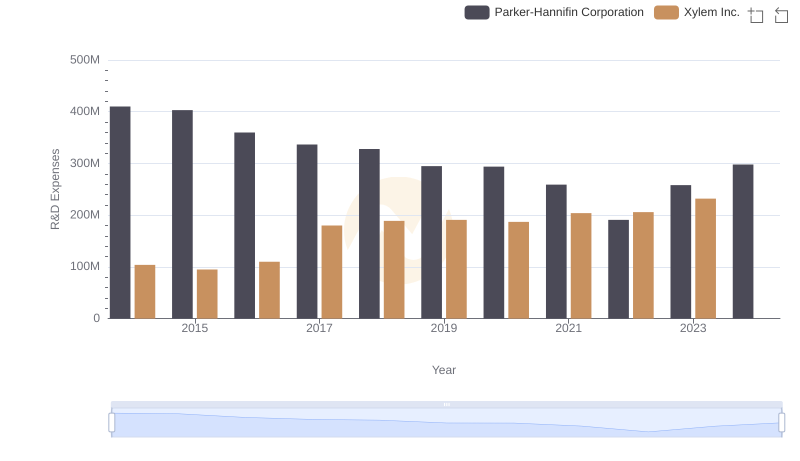
Research and Development Expenses Breakdown: Parker-Hannifin Corporation vs Xylem Inc.
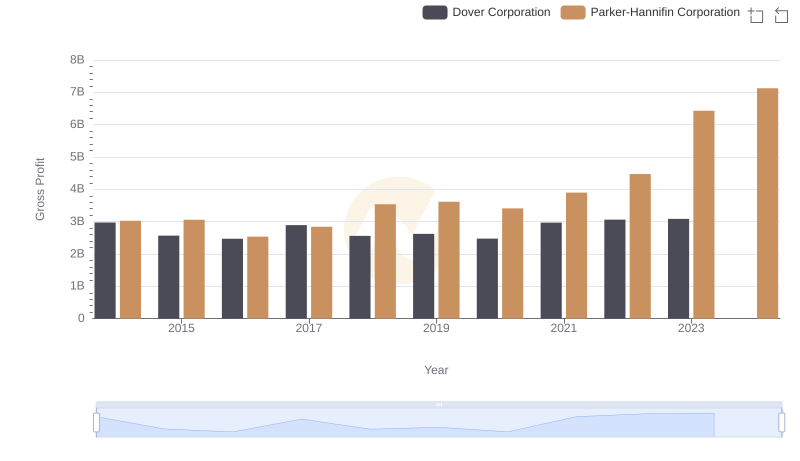
Gross Profit Comparison: Parker-Hannifin Corporation and Dover Corporation Trends
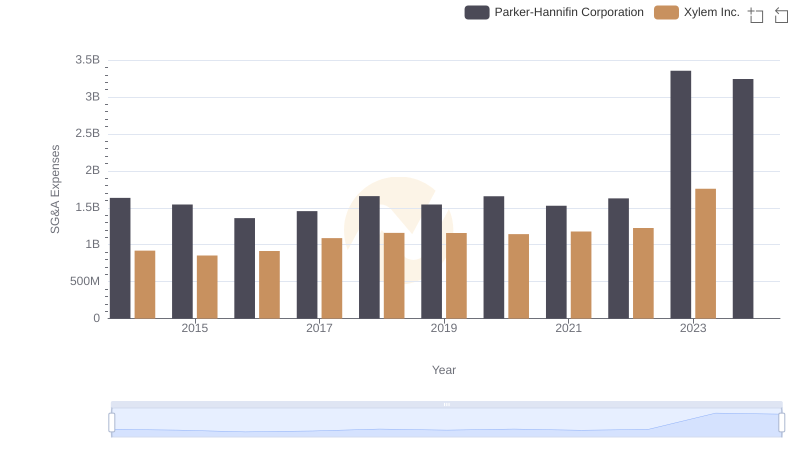
Cost Management Insights: SG&A Expenses for Parker-Hannifin Corporation and Xylem Inc.
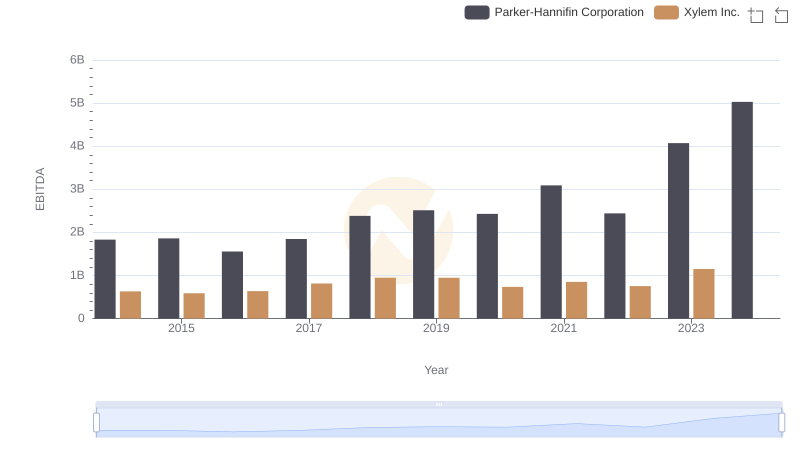
A Professional Review of EBITDA: Parker-Hannifin Corporation Compared to Xylem Inc.