| __timestamp | Dover Corporation | Parker-Hannifin Corporation |
|---|---|---|
| Wednesday, January 1, 2014 | 2974249000 | 3027744000 |
| Thursday, January 1, 2015 | 2568144000 | 3056499000 |
| Friday, January 1, 2016 | 2471969000 | 2537369000 |
| Sunday, January 1, 2017 | 2890377000 | 2840350000 |
| Monday, January 1, 2018 | 2559556000 | 3539551000 |
| Tuesday, January 1, 2019 | 2620938000 | 3616840000 |
| Wednesday, January 1, 2020 | 2474019000 | 3409002000 |
| Friday, January 1, 2021 | 2969786000 | 3897960000 |
| Saturday, January 1, 2022 | 3063556000 | 4474341000 |
| Sunday, January 1, 2023 | 3084633000 | 6429302000 |
| Monday, January 1, 2024 | 2958621000 | 7127790000 |
In pursuit of knowledge
In the ever-evolving landscape of industrial manufacturing, Parker-Hannifin Corporation and Dover Corporation have long been titans. Over the past decade, Parker-Hannifin has consistently outperformed Dover in terms of gross profit, showcasing a robust growth trajectory. From 2014 to 2023, Parker-Hannifin's gross profit surged by over 110%, peaking in 2023 with a remarkable 6.43 billion, while Dover's growth was more modest, increasing by approximately 4% over the same period.
The data reveals a pivotal moment in 2018 when Parker-Hannifin's gross profit began to significantly outpace Dover's, marking a strategic shift in market dominance. Despite Dover's steady performance, Parker-Hannifin's aggressive expansion and innovation strategies have clearly paid off. As we look to the future, the absence of data for Dover in 2024 leaves us pondering whether they can close the gap or if Parker-Hannifin will continue to lead the charge.

Who Generates More Revenue? Parker-Hannifin Corporation or Dover Corporation
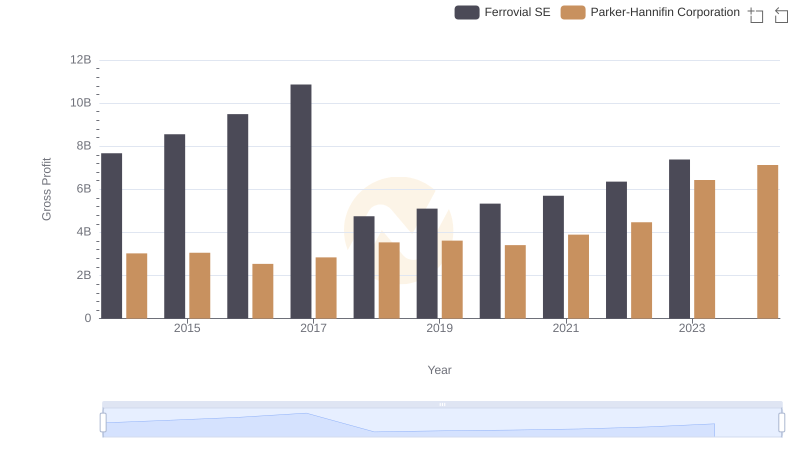
Parker-Hannifin Corporation and Ferrovial SE: A Detailed Gross Profit Analysis
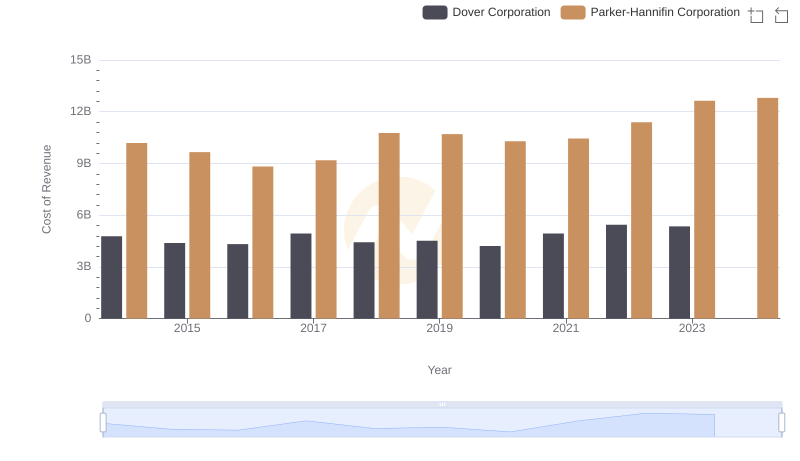
Cost Insights: Breaking Down Parker-Hannifin Corporation and Dover Corporation's Expenses
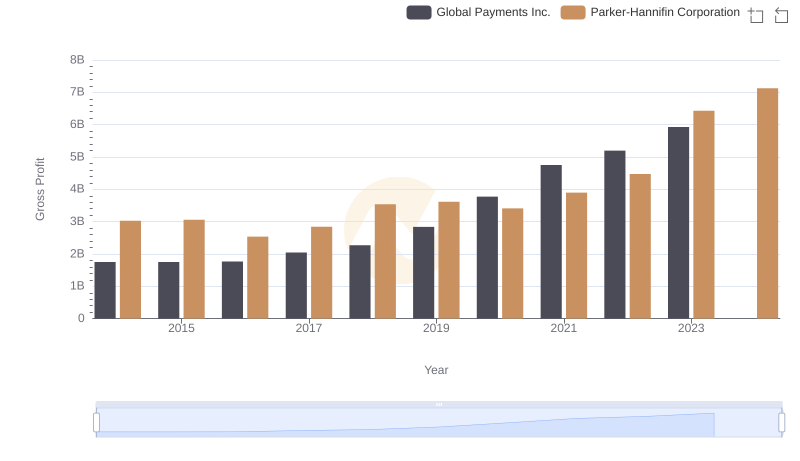
Gross Profit Comparison: Parker-Hannifin Corporation and Global Payments Inc. Trends
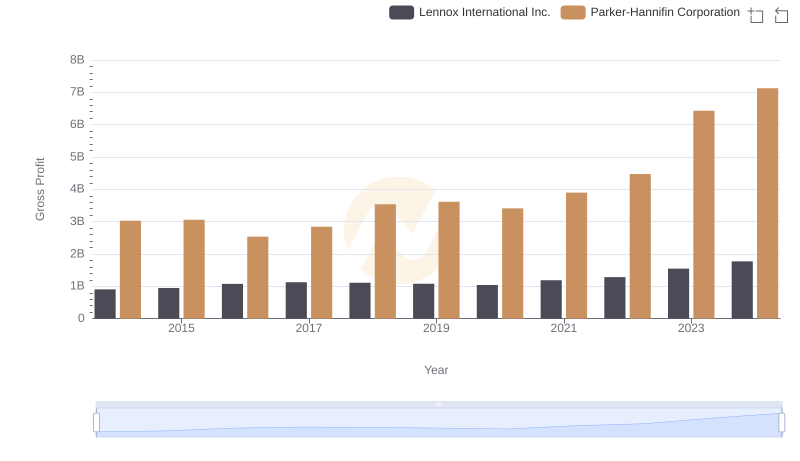
Gross Profit Comparison: Parker-Hannifin Corporation and Lennox International Inc. Trends
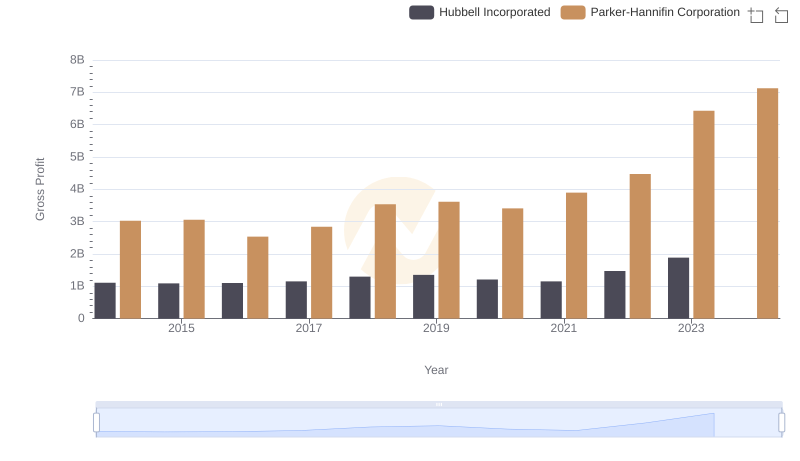
Gross Profit Comparison: Parker-Hannifin Corporation and Hubbell Incorporated Trends
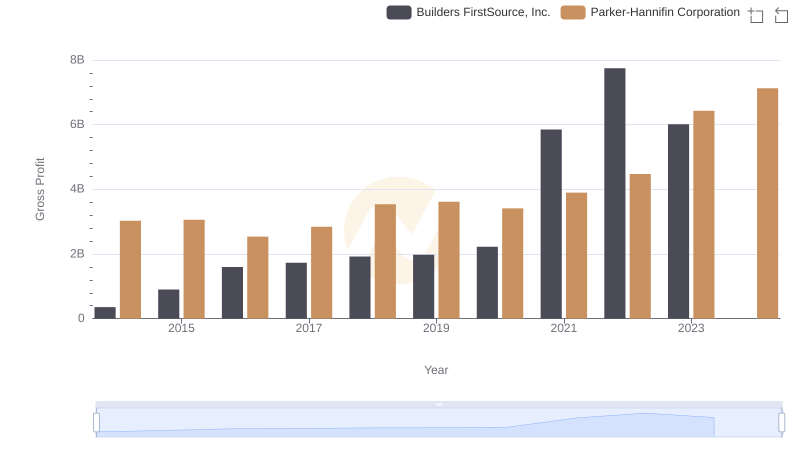
Parker-Hannifin Corporation and Builders FirstSource, Inc.: A Detailed Gross Profit Analysis
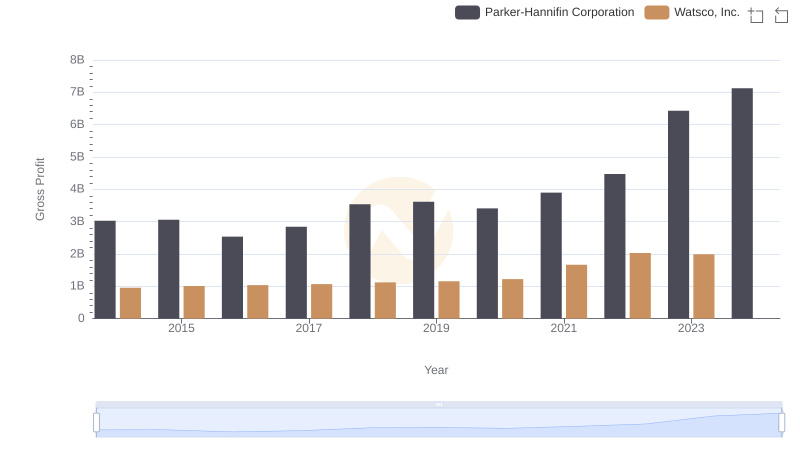
Gross Profit Comparison: Parker-Hannifin Corporation and Watsco, Inc. Trends
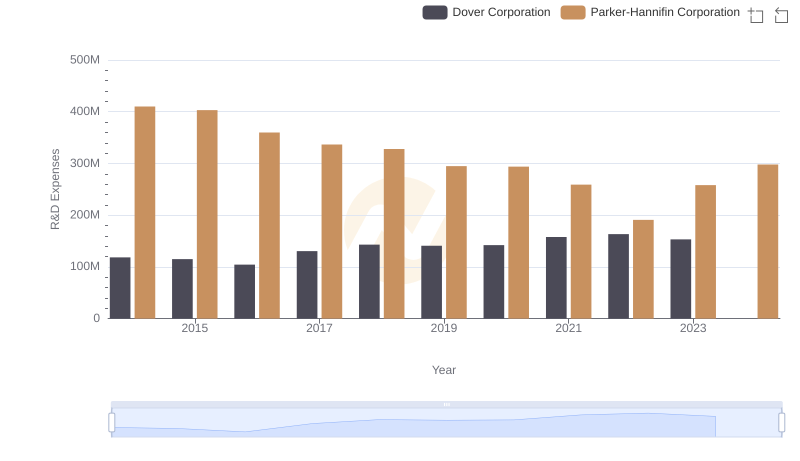
Research and Development: Comparing Key Metrics for Parker-Hannifin Corporation and Dover Corporation
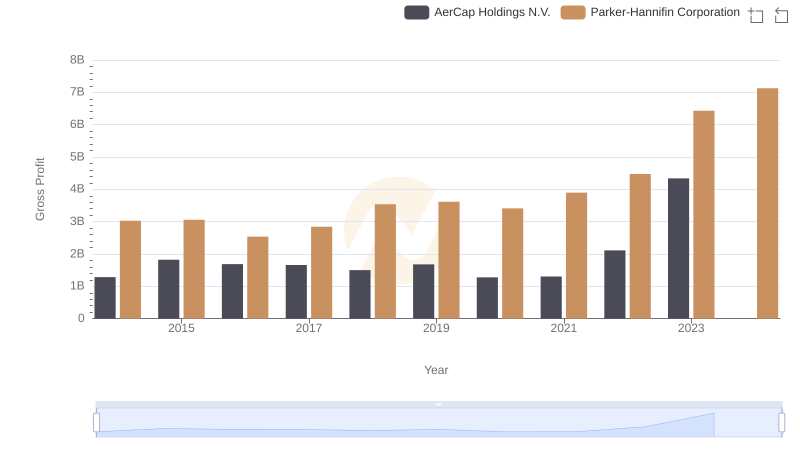
Gross Profit Trends Compared: Parker-Hannifin Corporation vs AerCap Holdings N.V.
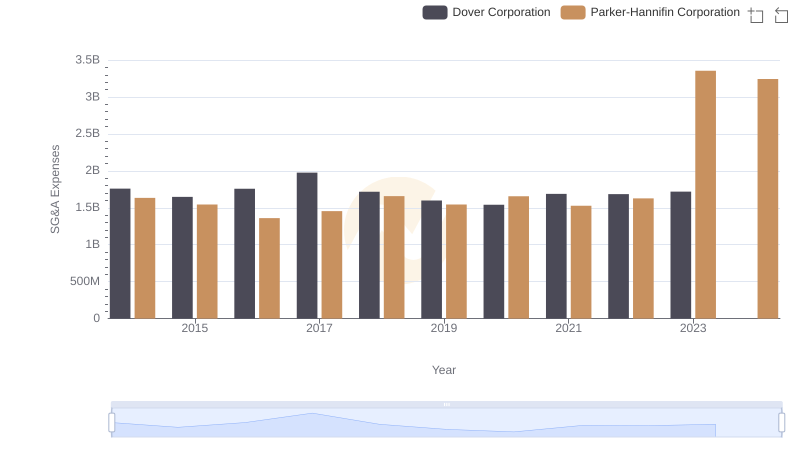
Parker-Hannifin Corporation and Dover Corporation: SG&A Spending Patterns Compared