| __timestamp | Ferguson plc | Parker-Hannifin Corporation |
|---|---|---|
| Wednesday, January 1, 2014 | 6203188666 | 3027744000 |
| Thursday, January 1, 2015 | 5816457079 | 3056499000 |
| Friday, January 1, 2016 | 5389727937 | 2537369000 |
| Sunday, January 1, 2017 | 5793596551 | 2840350000 |
| Monday, January 1, 2018 | 6044000000 | 3539551000 |
| Tuesday, January 1, 2019 | 6458000000 | 3616840000 |
| Wednesday, January 1, 2020 | 6421000000 | 3409002000 |
| Friday, January 1, 2021 | 6980000000 | 3897960000 |
| Saturday, January 1, 2022 | 8756000000 | 4474341000 |
| Sunday, January 1, 2023 | 9025000000 | 6429302000 |
| Monday, January 1, 2024 | 9053000000 | 7127790000 |
Unlocking the unknown
In the ever-evolving landscape of industrial manufacturing, Parker-Hannifin Corporation and Ferguson plc have emerged as titans, each carving out a significant niche. Over the past decade, Ferguson plc has consistently outperformed Parker-Hannifin in terms of gross profit, with a remarkable 31% increase from 2014 to 2024. Meanwhile, Parker-Hannifin has shown a robust growth trajectory, nearly doubling its gross profit in the same period.
This comparison highlights the dynamic nature of the industrial sector and the strategic maneuvers of these two industry leaders.
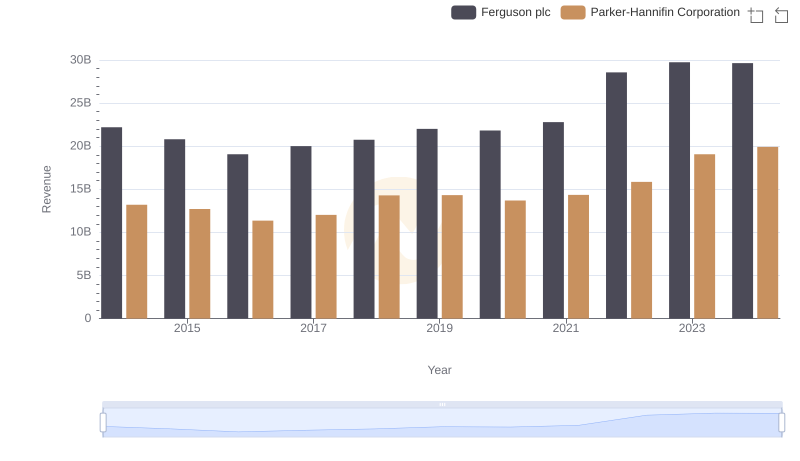
Parker-Hannifin Corporation vs Ferguson plc: Annual Revenue Growth Compared
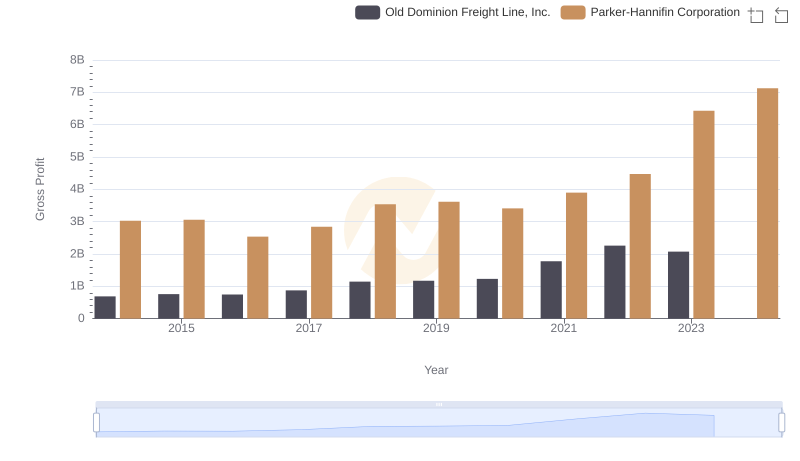
Parker-Hannifin Corporation vs Old Dominion Freight Line, Inc.: A Gross Profit Performance Breakdown

Cost of Revenue Comparison: Parker-Hannifin Corporation vs Ferguson plc
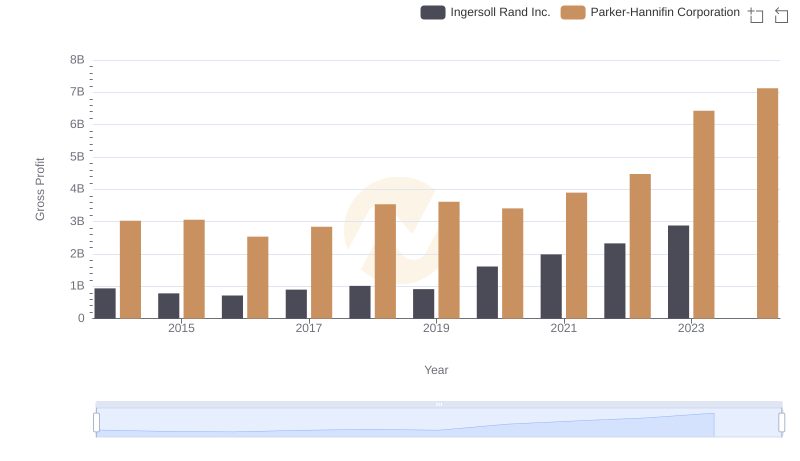
Gross Profit Analysis: Comparing Parker-Hannifin Corporation and Ingersoll Rand Inc.

Who Generates Higher Gross Profit? Parker-Hannifin Corporation or Westinghouse Air Brake Technologies Corporation
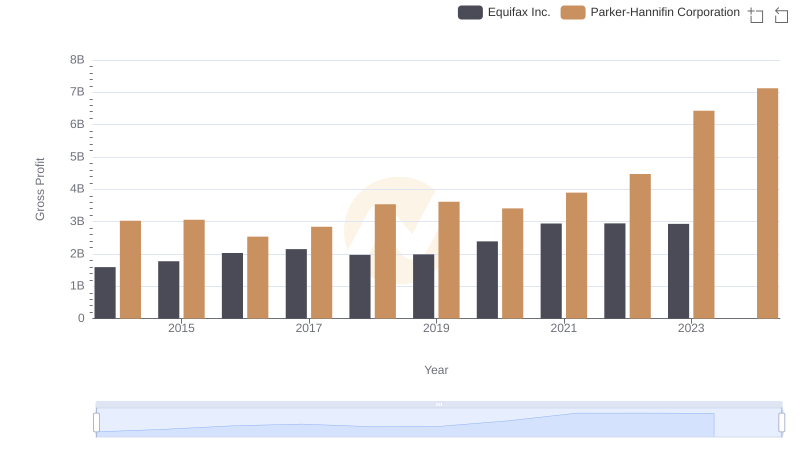
Parker-Hannifin Corporation and Equifax Inc.: A Detailed Gross Profit Analysis
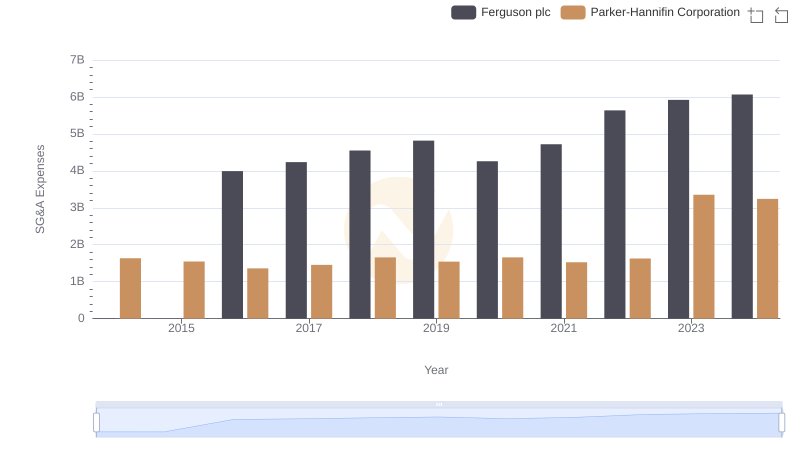
SG&A Efficiency Analysis: Comparing Parker-Hannifin Corporation and Ferguson plc
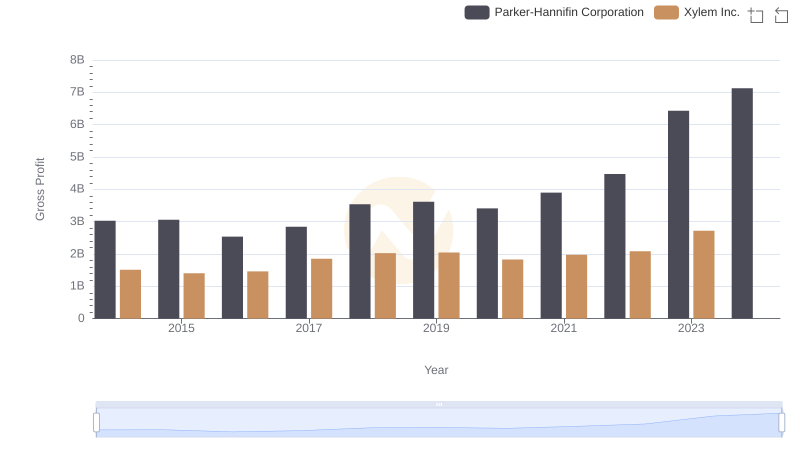
Gross Profit Analysis: Comparing Parker-Hannifin Corporation and Xylem Inc.
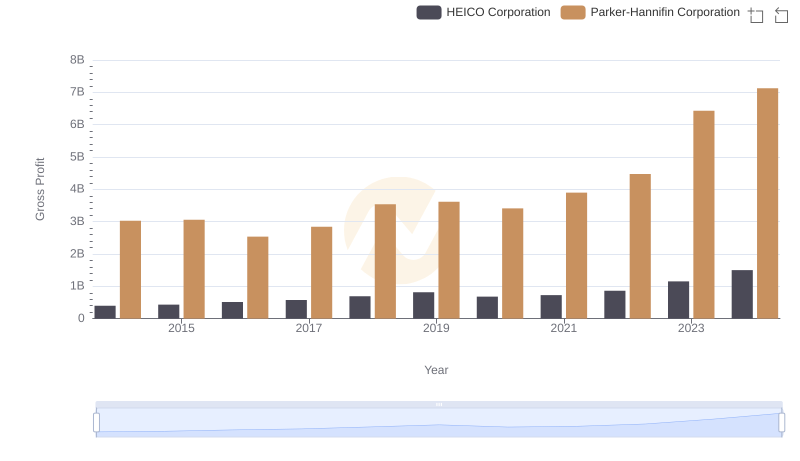
Parker-Hannifin Corporation vs HEICO Corporation: A Gross Profit Performance Breakdown
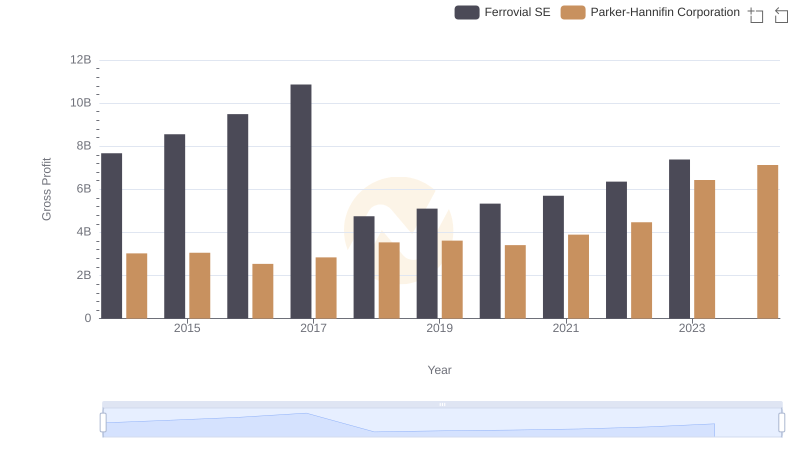
Parker-Hannifin Corporation and Ferrovial SE: A Detailed Gross Profit Analysis
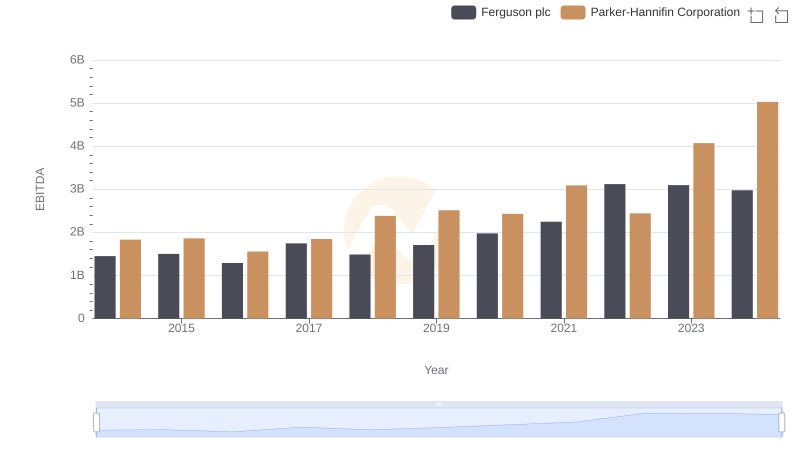
A Side-by-Side Analysis of EBITDA: Parker-Hannifin Corporation and Ferguson plc