| __timestamp | HEICO Corporation | Parker-Hannifin Corporation |
|---|---|---|
| Wednesday, January 1, 2014 | 251213000 | 1832903000 |
| Thursday, January 1, 2015 | 276790000 | 1861551000 |
| Friday, January 1, 2016 | 325022000 | 1558088000 |
| Sunday, January 1, 2017 | 372581000 | 1846306000 |
| Monday, January 1, 2018 | 452287000 | 2382235000 |
| Tuesday, January 1, 2019 | 542136000 | 2513468000 |
| Wednesday, January 1, 2020 | 465714000 | 2431500000 |
| Friday, January 1, 2021 | 486243000 | 3092383000 |
| Saturday, January 1, 2022 | 592709000 | 2441242000 |
| Sunday, January 1, 2023 | 756767000 | 4071687000 |
| Monday, January 1, 2024 | 824455000 | 5028229000 |
Unlocking the unknown
In the competitive landscape of industrial manufacturing, Parker-Hannifin Corporation and HEICO Corporation have demonstrated remarkable EBITDA growth over the past decade. From 2014 to 2024, Parker-Hannifin's EBITDA surged by approximately 174%, reaching a peak in 2024. Meanwhile, HEICO Corporation experienced an impressive 228% increase in the same period.
This analysis highlights the strategic maneuvers and market positioning that have propelled these industrial giants to new heights.
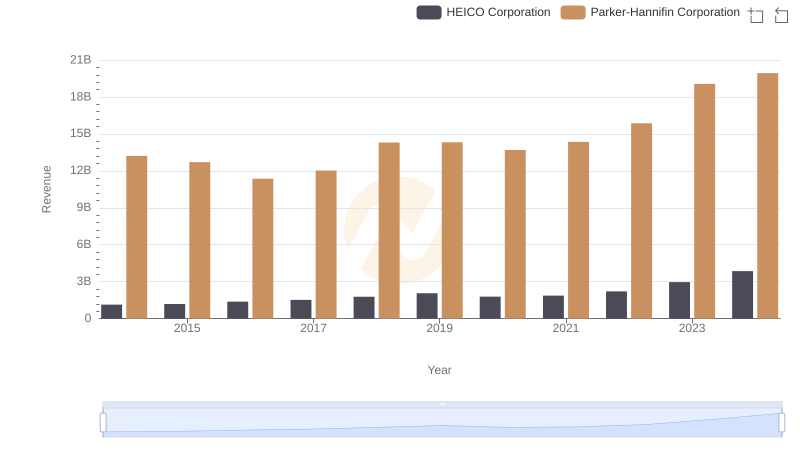
Comparing Revenue Performance: Parker-Hannifin Corporation or HEICO Corporation?
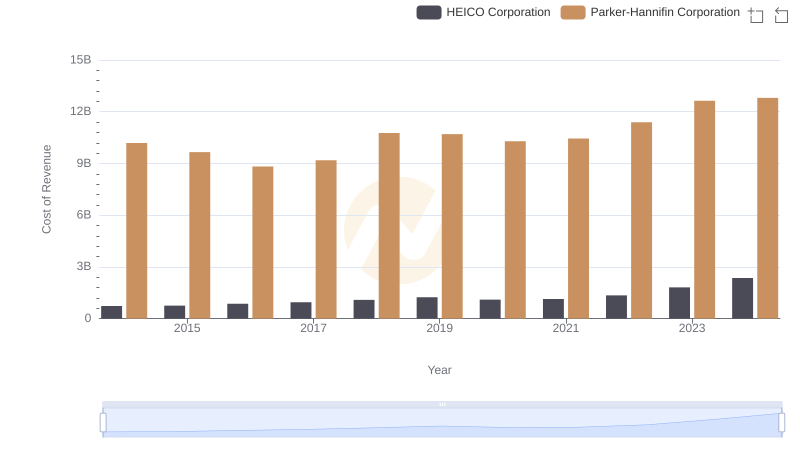
Cost of Revenue Comparison: Parker-Hannifin Corporation vs HEICO Corporation
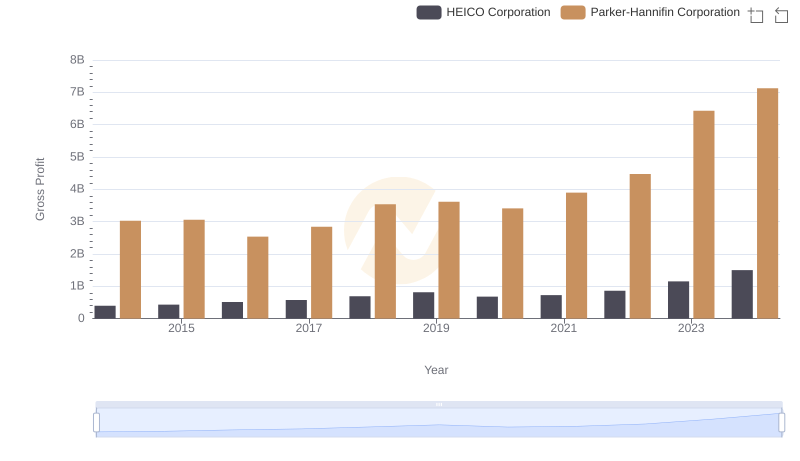
Parker-Hannifin Corporation vs HEICO Corporation: A Gross Profit Performance Breakdown
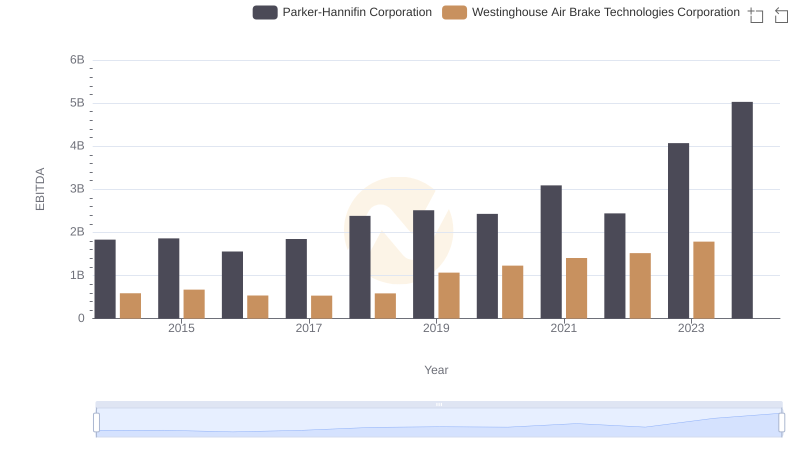
Parker-Hannifin Corporation vs Westinghouse Air Brake Technologies Corporation: In-Depth EBITDA Performance Comparison
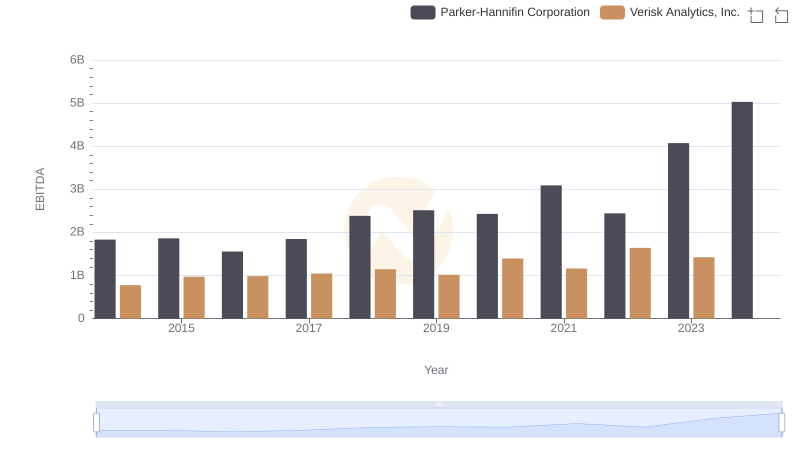
Parker-Hannifin Corporation vs Verisk Analytics, Inc.: In-Depth EBITDA Performance Comparison
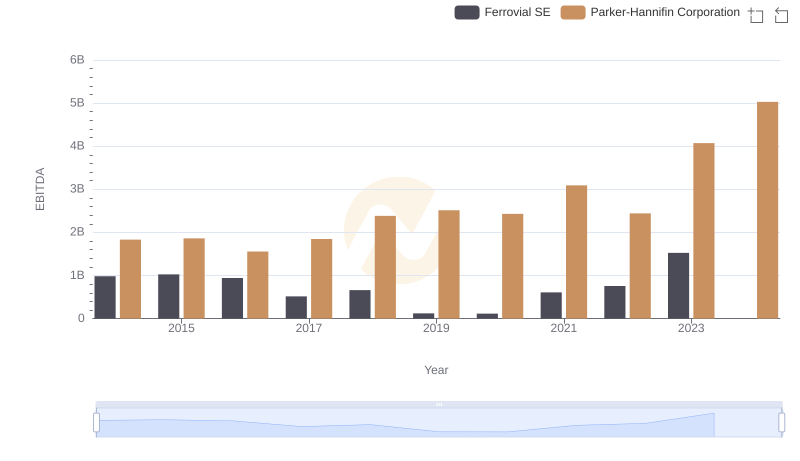
Professional EBITDA Benchmarking: Parker-Hannifin Corporation vs Ferrovial SE
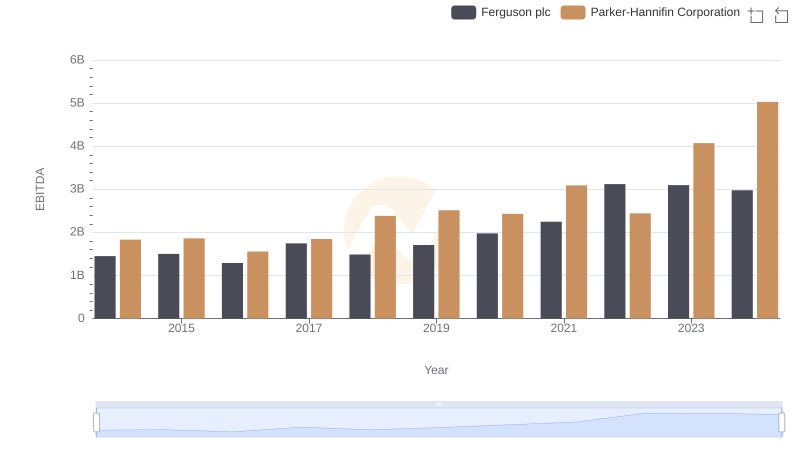
A Side-by-Side Analysis of EBITDA: Parker-Hannifin Corporation and Ferguson plc
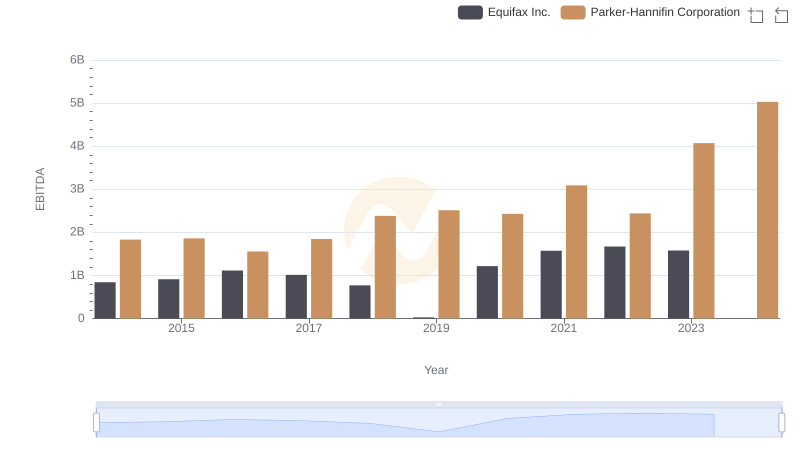
Parker-Hannifin Corporation vs Equifax Inc.: In-Depth EBITDA Performance Comparison
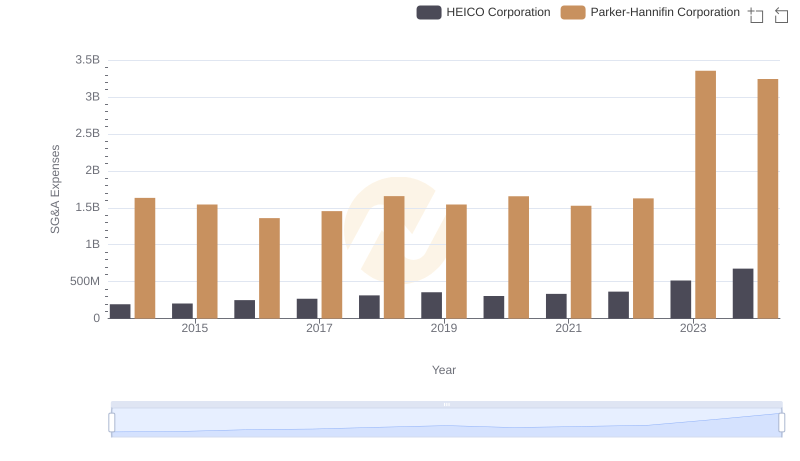
Breaking Down SG&A Expenses: Parker-Hannifin Corporation vs HEICO Corporation
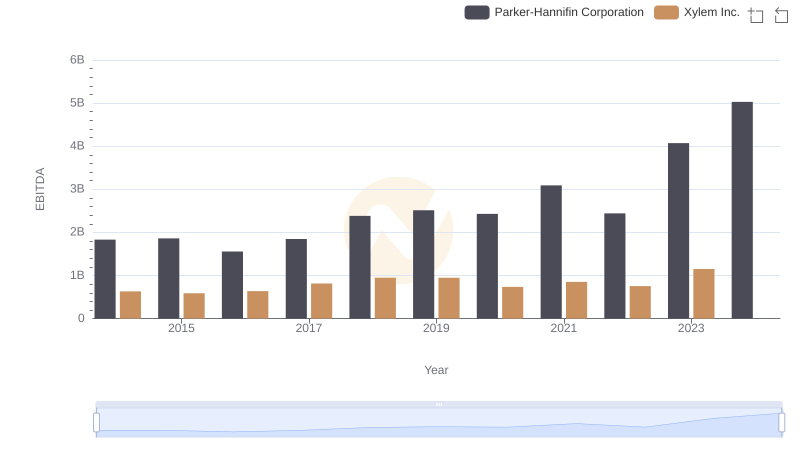
A Professional Review of EBITDA: Parker-Hannifin Corporation Compared to Xylem Inc.
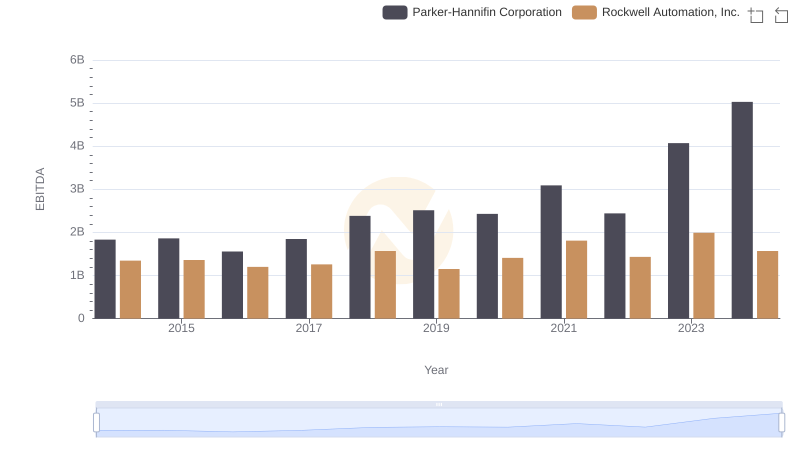
Parker-Hannifin Corporation vs Rockwell Automation, Inc.: In-Depth EBITDA Performance Comparison
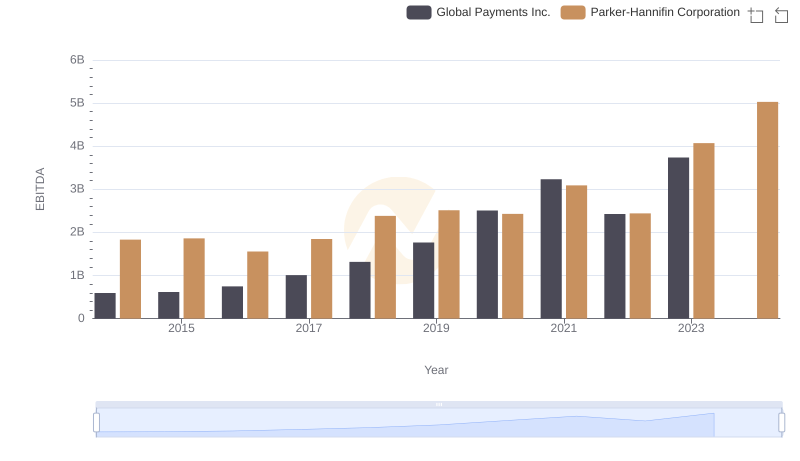
EBITDA Performance Review: Parker-Hannifin Corporation vs Global Payments Inc.