| __timestamp | Global Payments Inc. | Parker-Hannifin Corporation |
|---|---|---|
| Wednesday, January 1, 2014 | 1751611000 | 3027744000 |
| Thursday, January 1, 2015 | 1750511000 | 3056499000 |
| Friday, January 1, 2016 | 1767444000 | 2537369000 |
| Sunday, January 1, 2017 | 2047126000 | 2840350000 |
| Monday, January 1, 2018 | 2271352000 | 3539551000 |
| Tuesday, January 1, 2019 | 2838089000 | 3616840000 |
| Wednesday, January 1, 2020 | 3772831000 | 3409002000 |
| Friday, January 1, 2021 | 4750037000 | 3897960000 |
| Saturday, January 1, 2022 | 5196898000 | 4474341000 |
| Sunday, January 1, 2023 | 5926898000 | 6429302000 |
| Monday, January 1, 2024 | 6345778000 | 7127790000 |
Igniting the spark of knowledge
In the ever-evolving landscape of industrial and financial sectors, Parker-Hannifin Corporation and Global Payments Inc. have showcased intriguing trends in gross profit over the past decade. From 2014 to 2023, Parker-Hannifin's gross profit surged by approximately 112%, peaking at $6.43 billion in 2023. This growth reflects the company's robust adaptation to market demands and technological advancements.
Conversely, Global Payments Inc. experienced a remarkable 238% increase in gross profit, reaching $5.93 billion in 2023. This growth trajectory underscores the company's strategic expansions and innovations in the digital payment space.
While Parker-Hannifin's data extends into 2024, Global Payments' figures for that year remain unavailable, leaving room for speculation on future performance. These trends highlight the dynamic nature of these industries and the companies' resilience in navigating economic challenges.
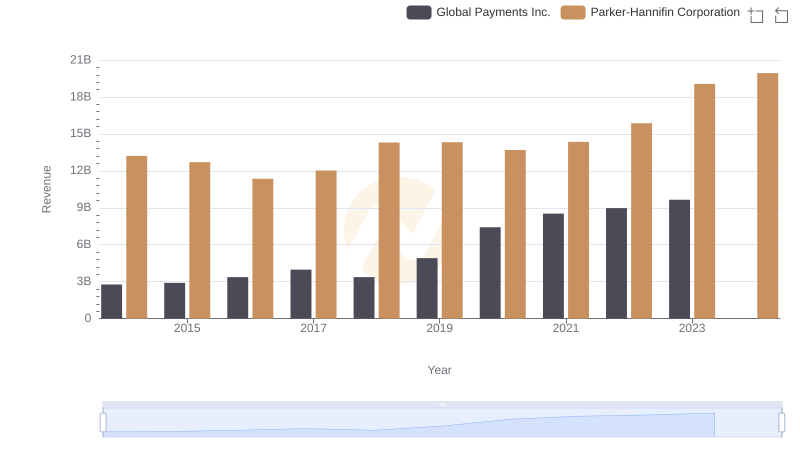
Annual Revenue Comparison: Parker-Hannifin Corporation vs Global Payments Inc.
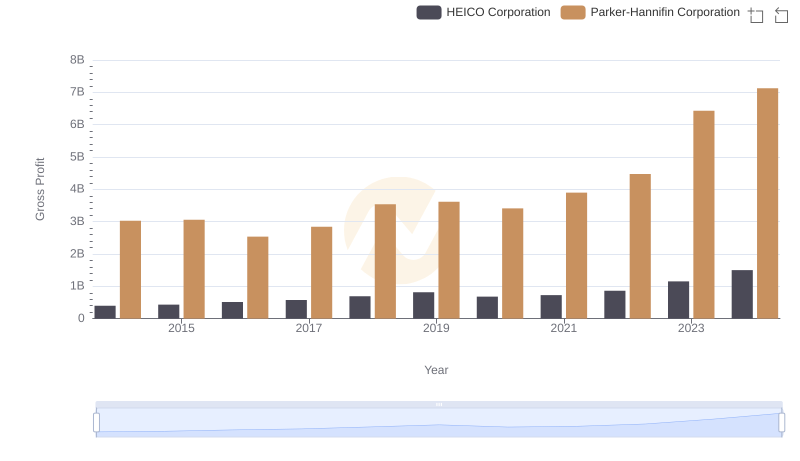
Parker-Hannifin Corporation vs HEICO Corporation: A Gross Profit Performance Breakdown
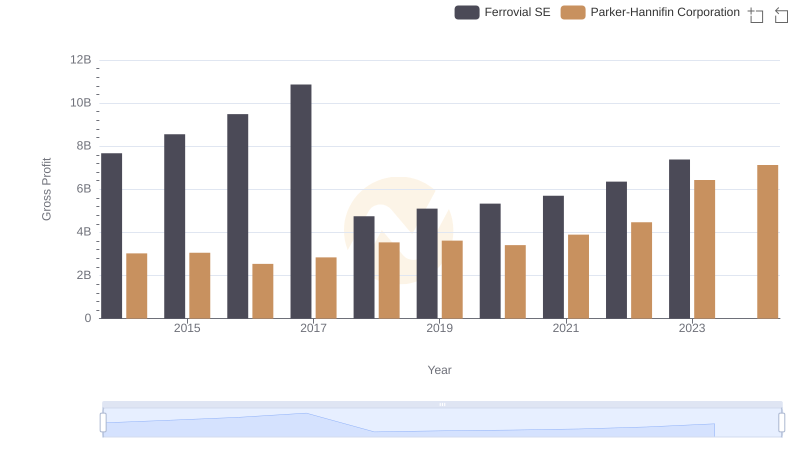
Parker-Hannifin Corporation and Ferrovial SE: A Detailed Gross Profit Analysis
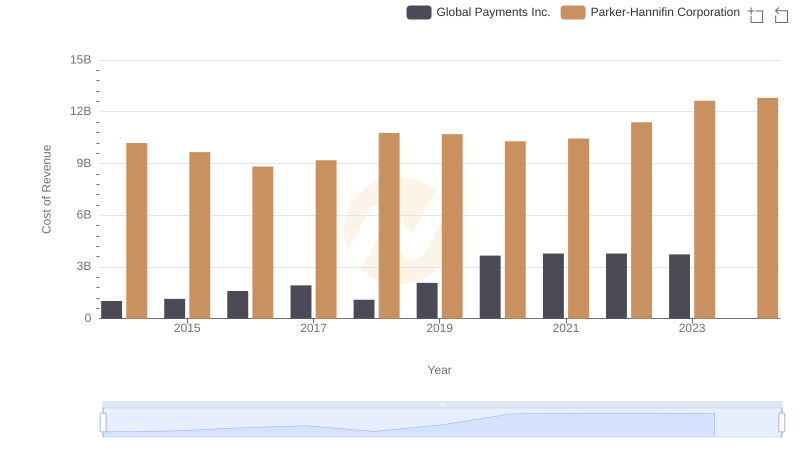
Cost Insights: Breaking Down Parker-Hannifin Corporation and Global Payments Inc.'s Expenses
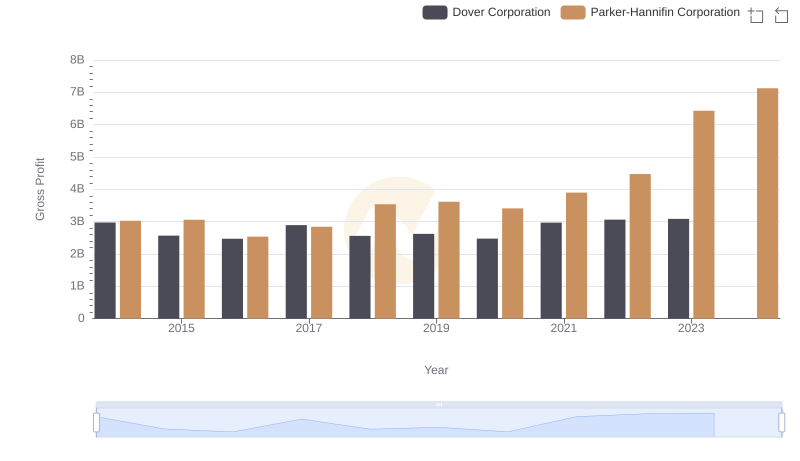
Gross Profit Comparison: Parker-Hannifin Corporation and Dover Corporation Trends
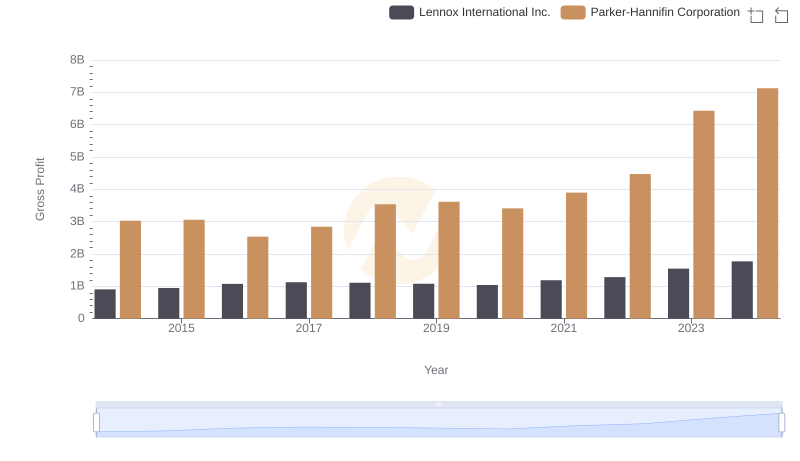
Gross Profit Comparison: Parker-Hannifin Corporation and Lennox International Inc. Trends
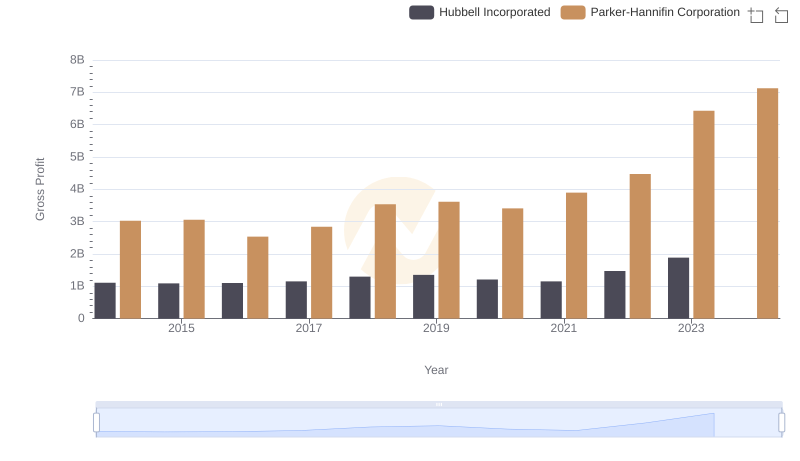
Gross Profit Comparison: Parker-Hannifin Corporation and Hubbell Incorporated Trends
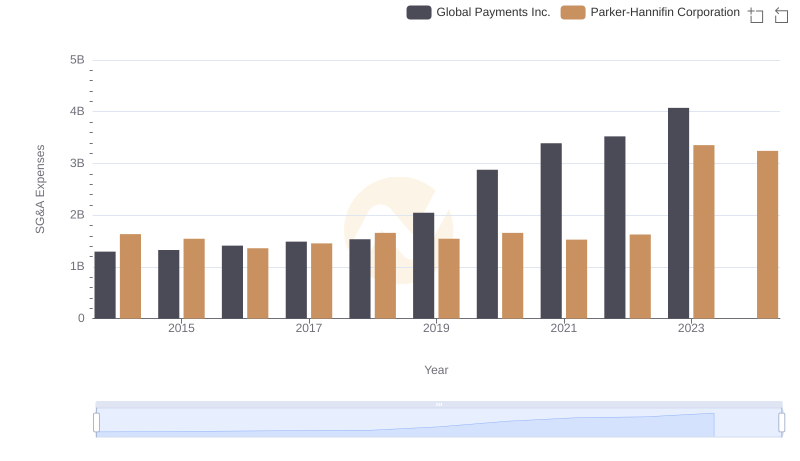
Parker-Hannifin Corporation vs Global Payments Inc.: SG&A Expense Trends
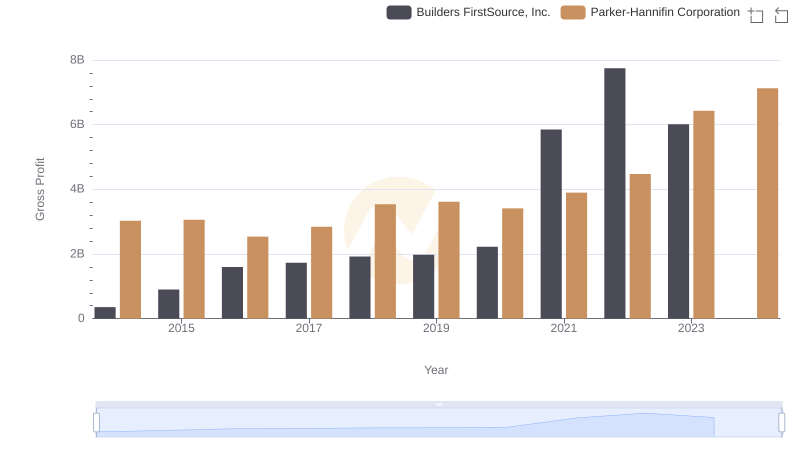
Parker-Hannifin Corporation and Builders FirstSource, Inc.: A Detailed Gross Profit Analysis
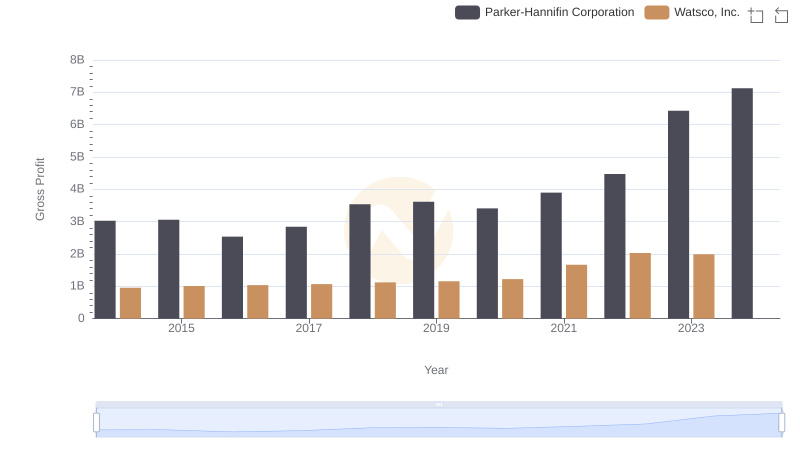
Gross Profit Comparison: Parker-Hannifin Corporation and Watsco, Inc. Trends
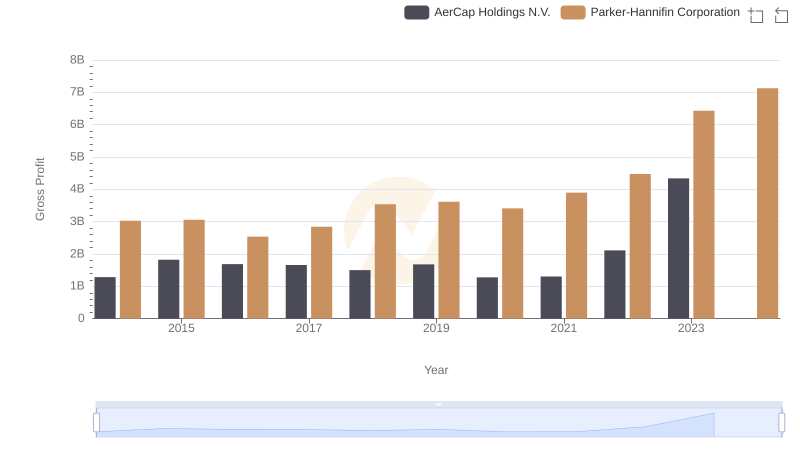
Gross Profit Trends Compared: Parker-Hannifin Corporation vs AerCap Holdings N.V.
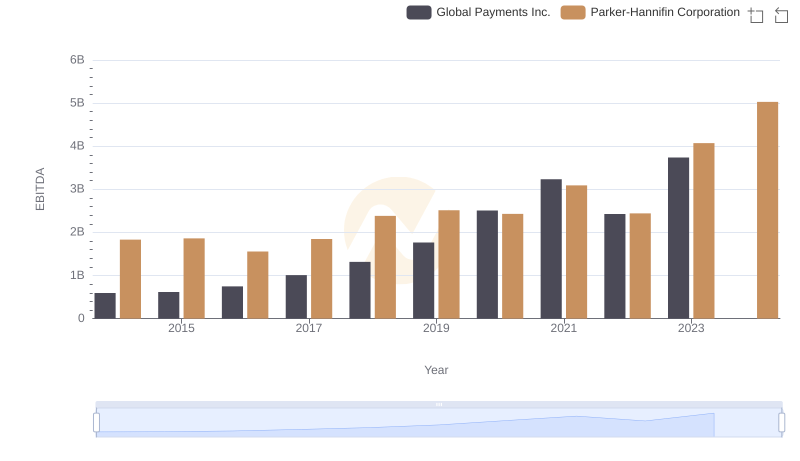
EBITDA Performance Review: Parker-Hannifin Corporation vs Global Payments Inc.