| __timestamp | HEICO Corporation | Parker-Hannifin Corporation |
|---|---|---|
| Wednesday, January 1, 2014 | 733999000 | 10188227000 |
| Thursday, January 1, 2015 | 754469000 | 9655245000 |
| Friday, January 1, 2016 | 860766000 | 8823384000 |
| Sunday, January 1, 2017 | 950088000 | 9188962000 |
| Monday, January 1, 2018 | 1087006000 | 10762841000 |
| Tuesday, January 1, 2019 | 1241807000 | 10703484000 |
| Wednesday, January 1, 2020 | 1104882000 | 10286518000 |
| Friday, January 1, 2021 | 1138259000 | 10449680000 |
| Saturday, January 1, 2022 | 1345563000 | 11387267000 |
| Sunday, January 1, 2023 | 1814617000 | 12635892000 |
| Monday, January 1, 2024 | 2355943000 | 12801816000 |
In pursuit of knowledge
In the competitive landscape of industrial manufacturing, Parker-Hannifin Corporation and HEICO Corporation have showcased distinct trajectories in their cost of revenue from 2014 to 2024. Parker-Hannifin, a leader in motion and control technologies, consistently reported higher costs, peaking at approximately $12.8 billion in 2024. This represents a steady increase of about 26% from 2014. Meanwhile, HEICO, a prominent aerospace and electronics company, saw its cost of revenue grow by an impressive 221%, reaching around $2.36 billion in 2024. This stark contrast highlights Parker-Hannifin's larger scale of operations compared to HEICO's rapid growth in a niche market. The data underscores the strategic differences in their business models, with Parker-Hannifin focusing on expansive operations and HEICO capitalizing on specialized sectors. As the industrial sector evolves, these trends offer valuable insights into the financial strategies of these two giants.
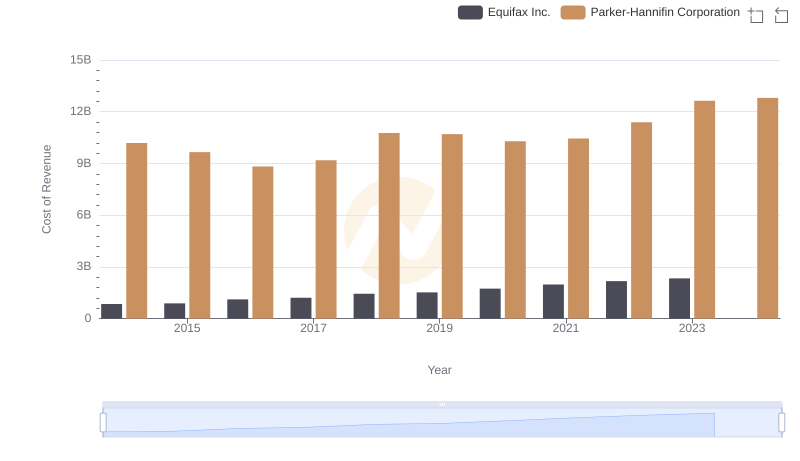
Analyzing Cost of Revenue: Parker-Hannifin Corporation and Equifax Inc.
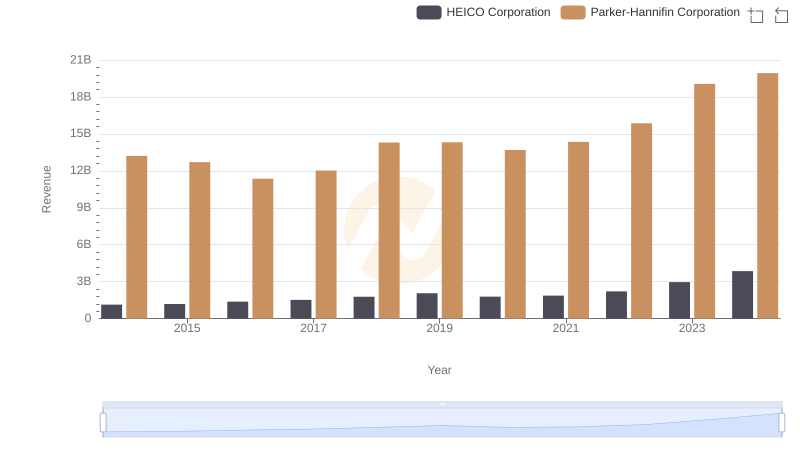
Comparing Revenue Performance: Parker-Hannifin Corporation or HEICO Corporation?
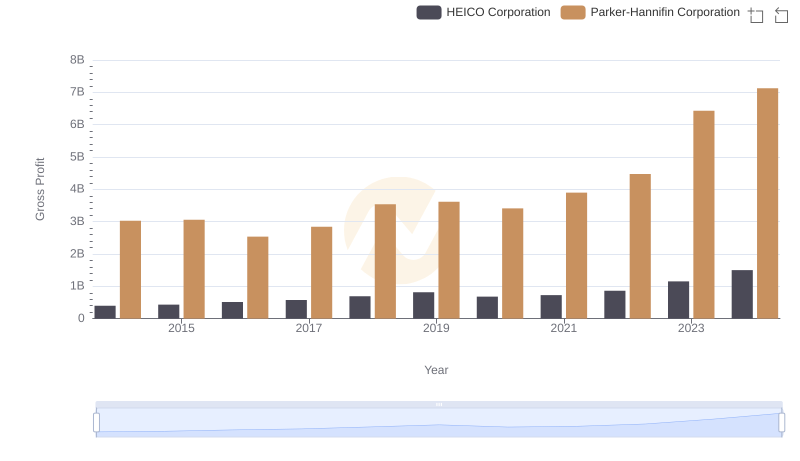
Parker-Hannifin Corporation vs HEICO Corporation: A Gross Profit Performance Breakdown
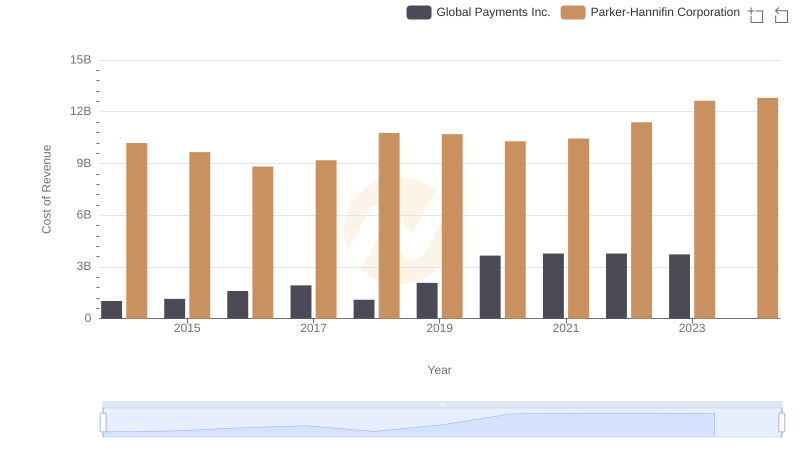
Cost Insights: Breaking Down Parker-Hannifin Corporation and Global Payments Inc.'s Expenses
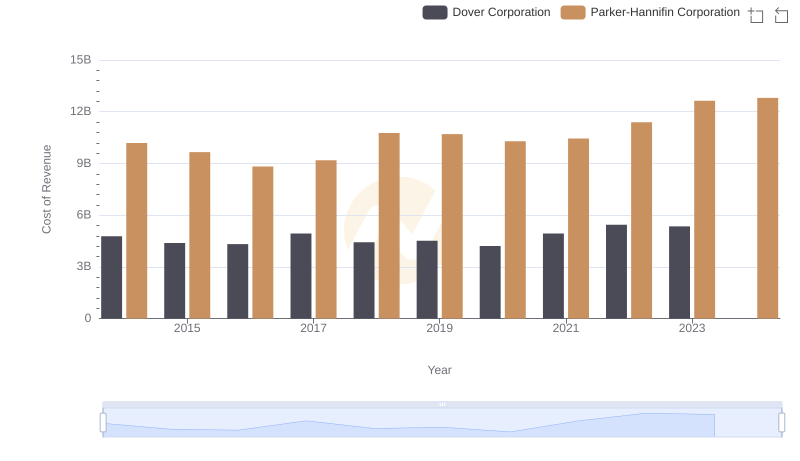
Cost Insights: Breaking Down Parker-Hannifin Corporation and Dover Corporation's Expenses
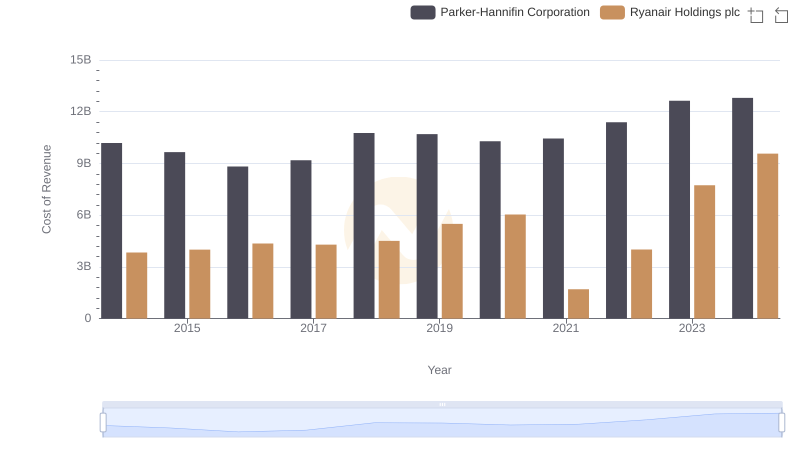
Cost Insights: Breaking Down Parker-Hannifin Corporation and Ryanair Holdings plc's Expenses
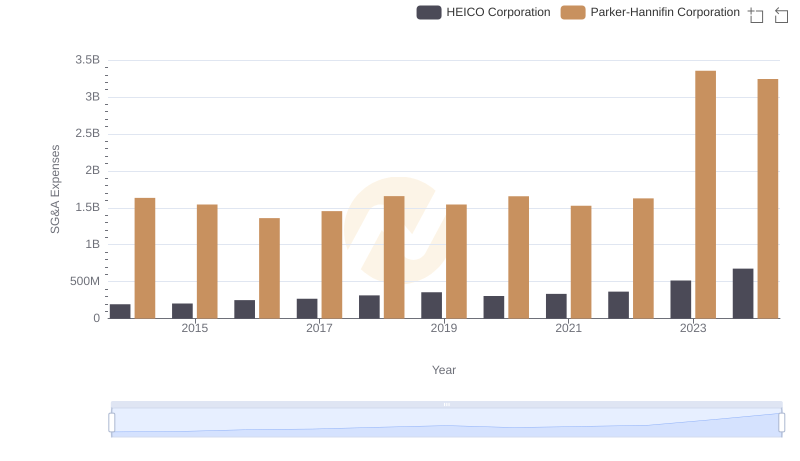
Breaking Down SG&A Expenses: Parker-Hannifin Corporation vs HEICO Corporation
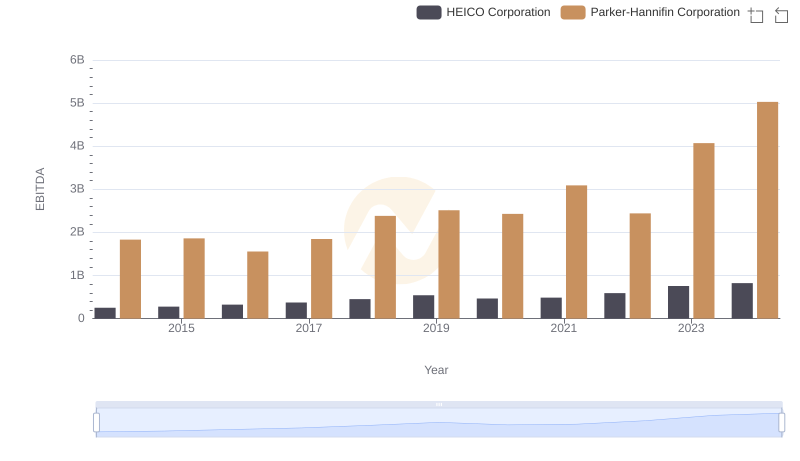
Comprehensive EBITDA Comparison: Parker-Hannifin Corporation vs HEICO Corporation