| __timestamp | HEICO Corporation | Parker-Hannifin Corporation |
|---|---|---|
| Wednesday, January 1, 2014 | 194924000 | 1633992000 |
| Thursday, January 1, 2015 | 204523000 | 1544746000 |
| Friday, January 1, 2016 | 250147000 | 1359360000 |
| Sunday, January 1, 2017 | 268067000 | 1453935000 |
| Monday, January 1, 2018 | 314470000 | 1657152000 |
| Tuesday, January 1, 2019 | 356743000 | 1543939000 |
| Wednesday, January 1, 2020 | 305479000 | 1656553000 |
| Friday, January 1, 2021 | 334523000 | 1527302000 |
| Saturday, January 1, 2022 | 365915000 | 1627116000 |
| Sunday, January 1, 2023 | 516292000 | 3354103000 |
| Monday, January 1, 2024 | 677271000 | 3315177000 |
Cracking the code
In the competitive landscape of industrial manufacturing, understanding the financial dynamics of key players is crucial. Parker-Hannifin Corporation and HEICO Corporation, both giants in their respective fields, have shown distinct trends in their Selling, General, and Administrative (SG&A) expenses over the past decade. From 2014 to 2024, Parker-Hannifin's SG&A expenses have consistently been higher, peaking in 2023 with a staggering 3.35 billion USD, nearly doubling from 2014. In contrast, HEICO's expenses, while significantly lower, have shown a remarkable growth trajectory, increasing by over 250% from 2014 to 2024. This divergence highlights Parker-Hannifin's expansive operational scale and HEICO's rapid growth strategy. As we move forward, these trends offer valuable insights into the strategic priorities and operational efficiencies of these industry leaders.
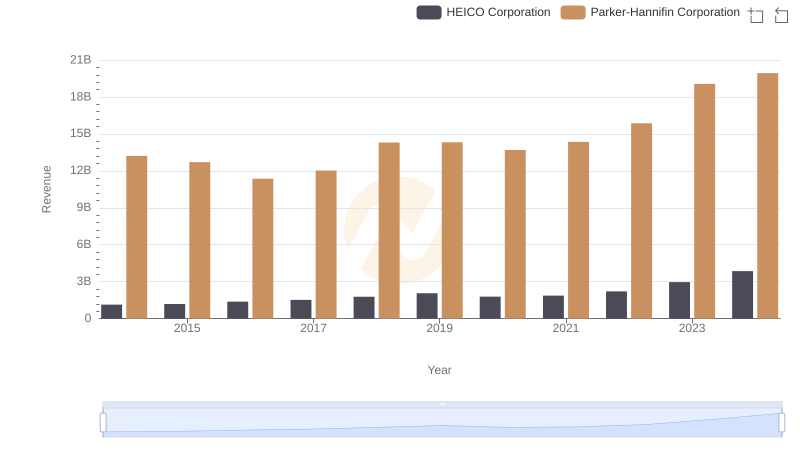
Comparing Revenue Performance: Parker-Hannifin Corporation or HEICO Corporation?
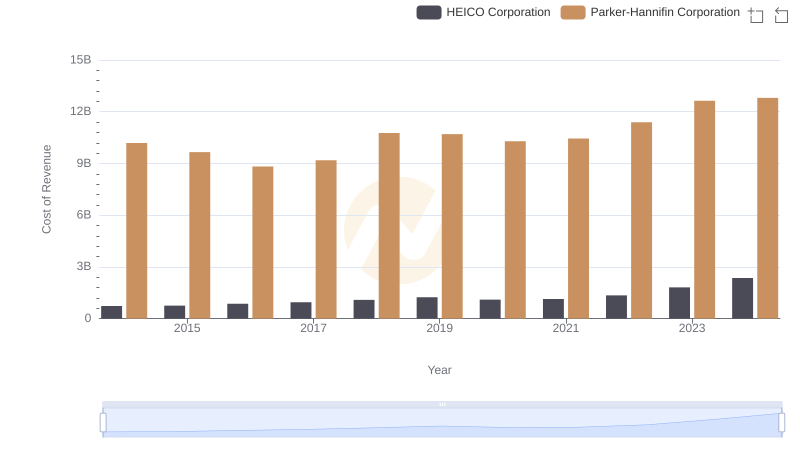
Cost of Revenue Comparison: Parker-Hannifin Corporation vs HEICO Corporation
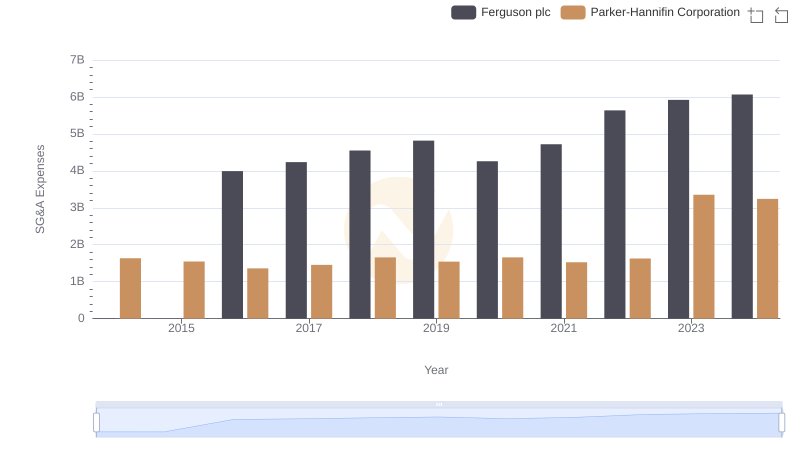
SG&A Efficiency Analysis: Comparing Parker-Hannifin Corporation and Ferguson plc
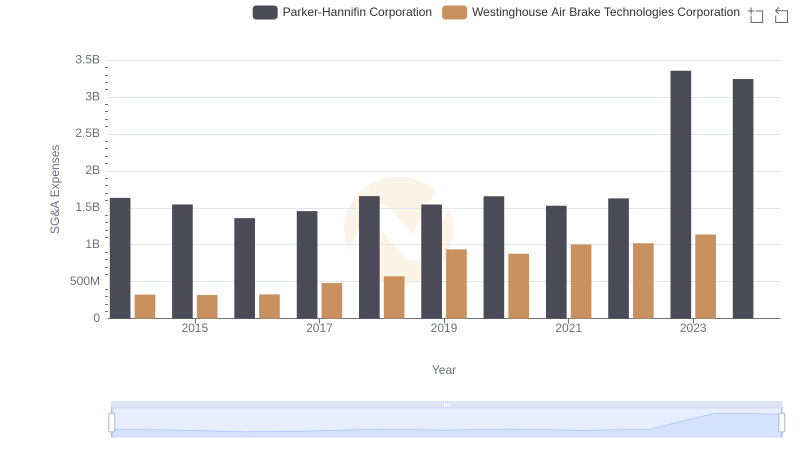
Cost Management Insights: SG&A Expenses for Parker-Hannifin Corporation and Westinghouse Air Brake Technologies Corporation
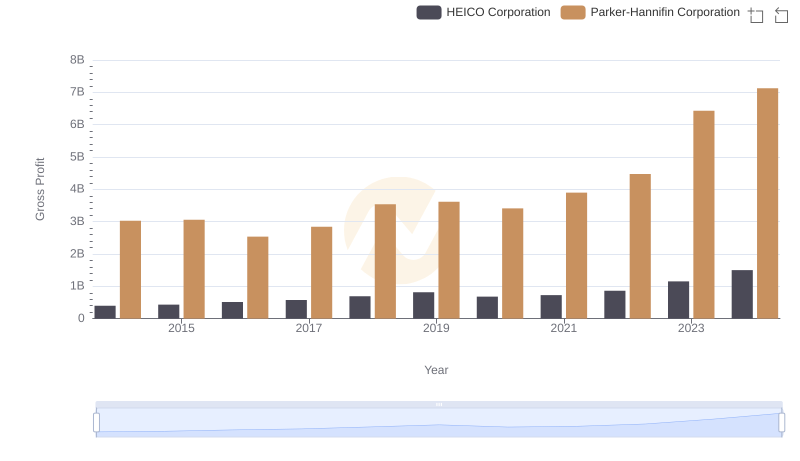
Parker-Hannifin Corporation vs HEICO Corporation: A Gross Profit Performance Breakdown
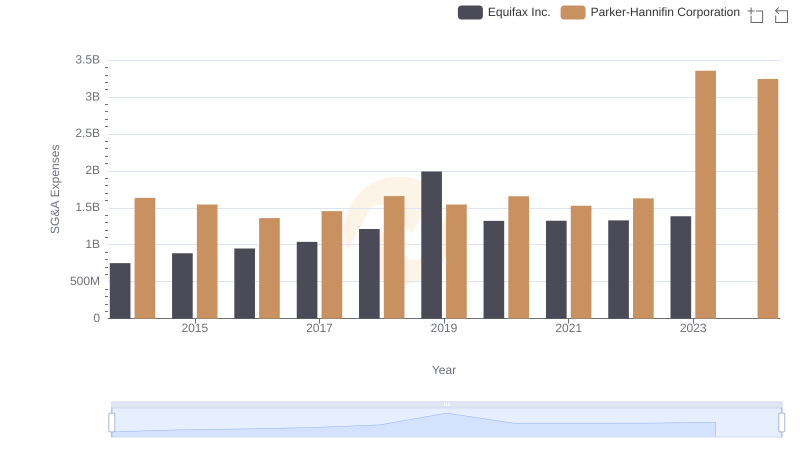
Cost Management Insights: SG&A Expenses for Parker-Hannifin Corporation and Equifax Inc.
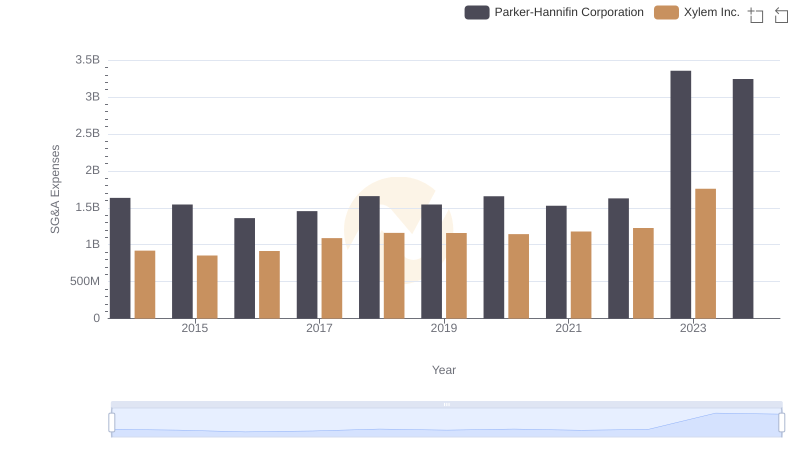
Cost Management Insights: SG&A Expenses for Parker-Hannifin Corporation and Xylem Inc.
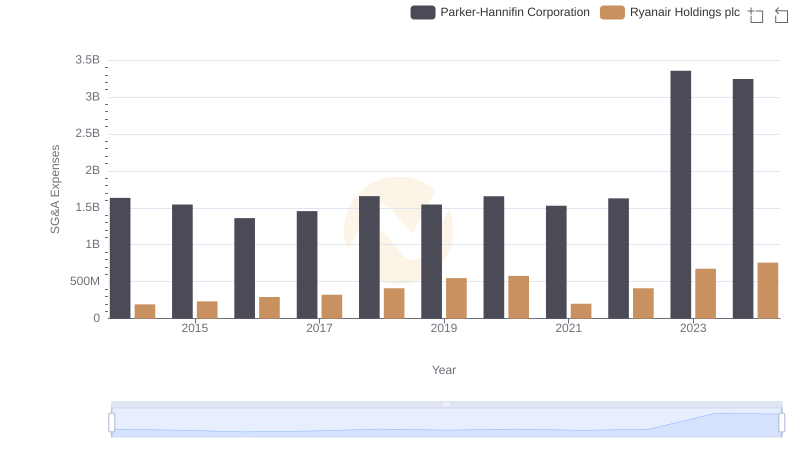
Parker-Hannifin Corporation and Ryanair Holdings plc: SG&A Spending Patterns Compared
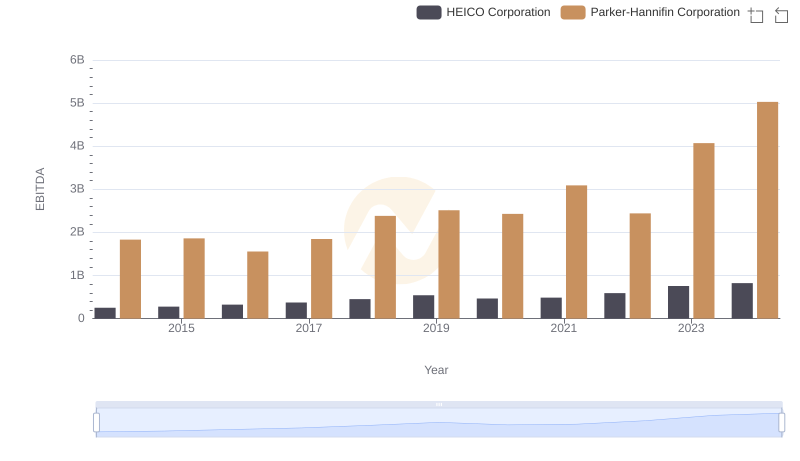
Comprehensive EBITDA Comparison: Parker-Hannifin Corporation vs HEICO Corporation
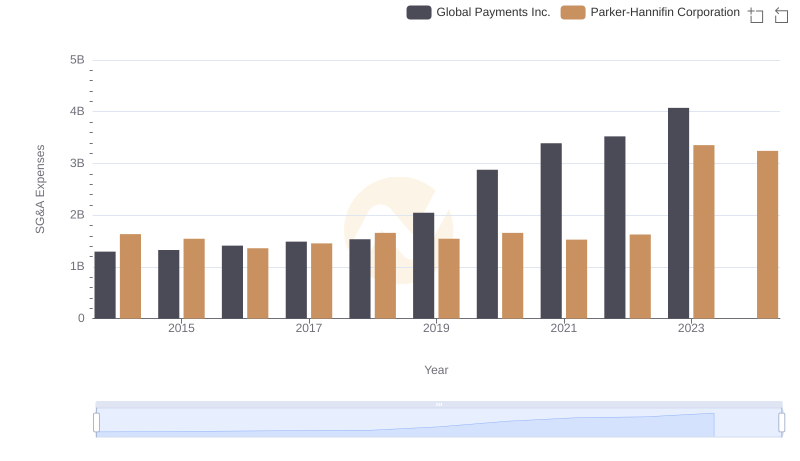
Parker-Hannifin Corporation vs Global Payments Inc.: SG&A Expense Trends