| __timestamp | The Boeing Company | XPO Logistics, Inc. |
|---|---|---|
| Wednesday, January 1, 2014 | 3767000000 | 422500000 |
| Thursday, January 1, 2015 | 3525000000 | 1113400000 |
| Friday, January 1, 2016 | 3616000000 | 1651200000 |
| Sunday, January 1, 2017 | 4094000000 | 1656500000 |
| Monday, January 1, 2018 | 4567000000 | 1837000000 |
| Tuesday, January 1, 2019 | 3909000000 | 1845000000 |
| Wednesday, January 1, 2020 | 4817000000 | 2172000000 |
| Friday, January 1, 2021 | 4157000000 | 1322000000 |
| Saturday, January 1, 2022 | 4187000000 | 678000000 |
| Sunday, January 1, 2023 | 5168000000 | 167000000 |
| Monday, January 1, 2024 | 5021000000 | 134000000 |
In pursuit of knowledge
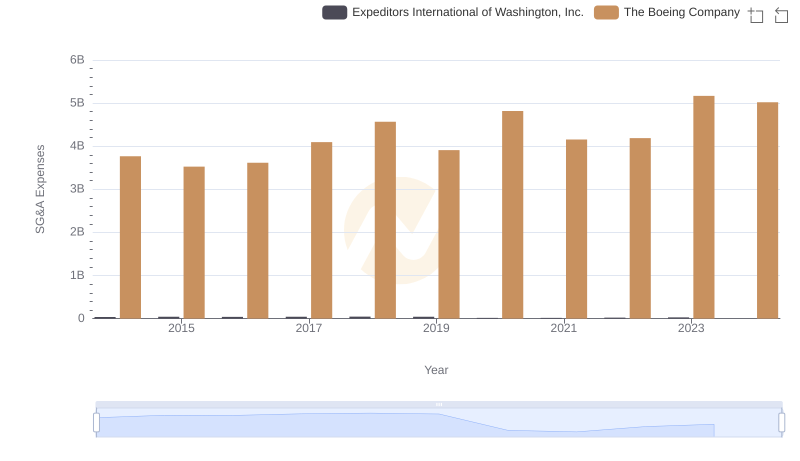
In the ever-evolving landscape of corporate America, operational efficiency is paramount. This analysis delves into the Selling, General, and Administrative (SG&A) expenses of two industry giants: The Boeing Company and XPO Logistics, Inc., from 2014 to 2023.
Boeing's SG&A expenses have shown a consistent upward trend, peaking in 2023 with a 37% increase from 2014. This reflects Boeing's strategic investments in innovation and market expansion, despite the challenges posed by global economic shifts.
Conversely, XPO Logistics experienced a more volatile trajectory. Their SG&A expenses surged by over 400% from 2014 to 2020, before a sharp decline in subsequent years. This volatility underscores XPO's aggressive growth strategies and subsequent restructuring efforts.
Notably, 2024 data for XPO is absent, suggesting potential reporting delays or strategic shifts. This missing data invites speculation on XPO's future operational strategies.

The Boeing Company vs XPO Logistics, Inc.: Examining Key Revenue Metrics
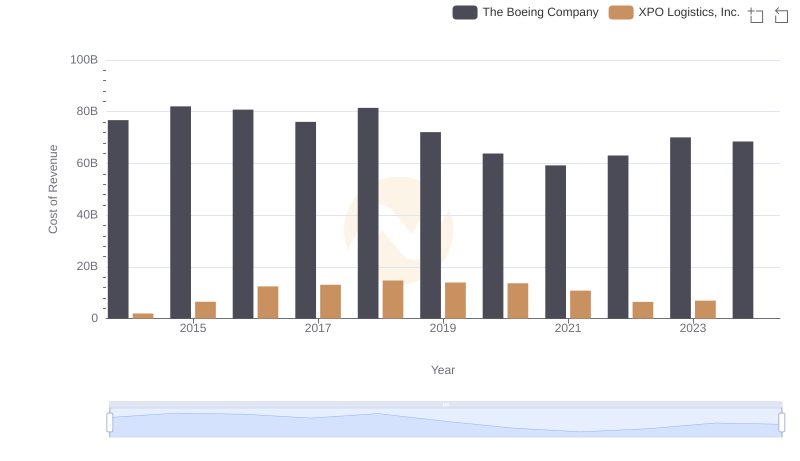
Analyzing Cost of Revenue: The Boeing Company and XPO Logistics, Inc.
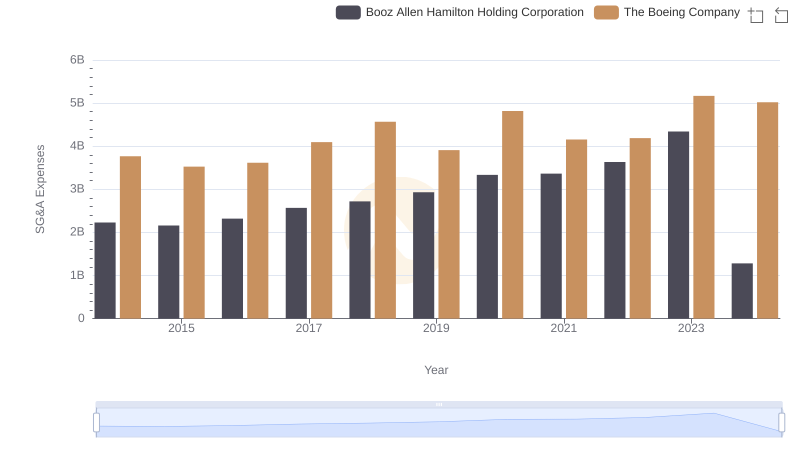
Operational Costs Compared: SG&A Analysis of The Boeing Company and Booz Allen Hamilton Holding Corporation
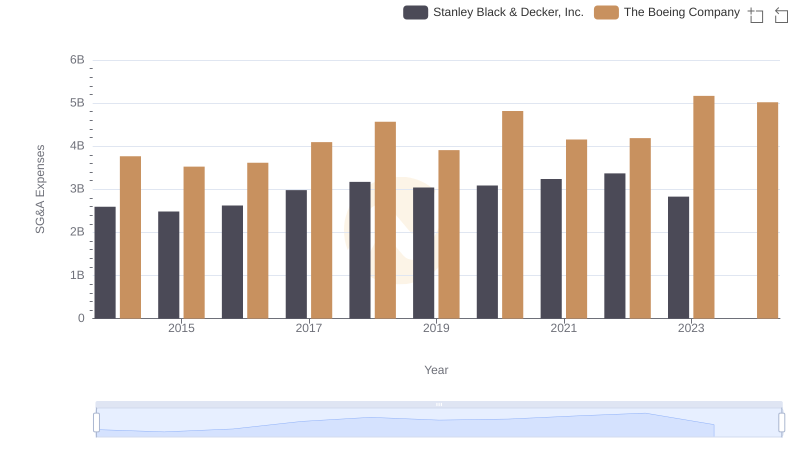
Selling, General, and Administrative Costs: The Boeing Company vs Stanley Black & Decker, Inc.
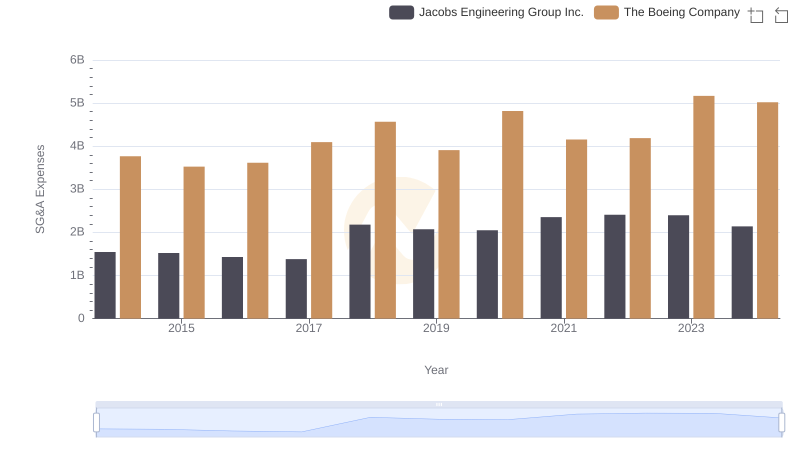
Breaking Down SG&A Expenses: The Boeing Company vs Jacobs Engineering Group Inc.
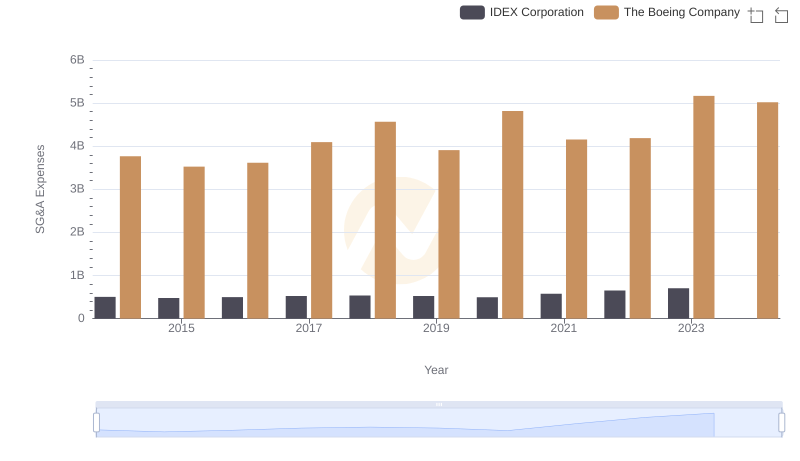
The Boeing Company and IDEX Corporation: SG&A Spending Patterns Compared
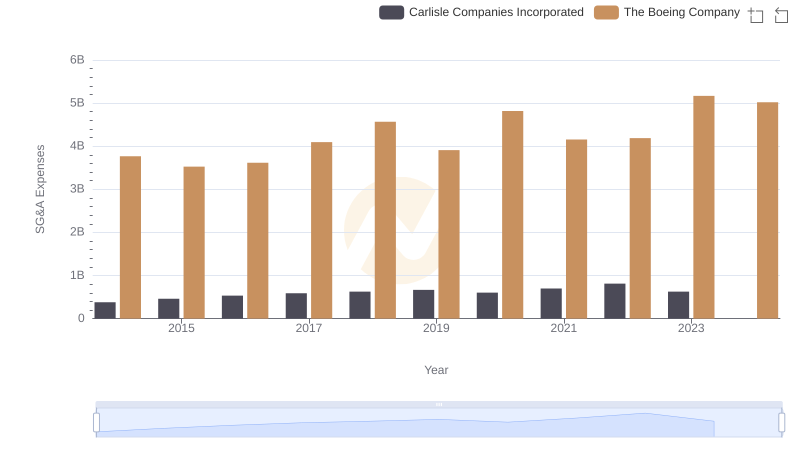
Who Optimizes SG&A Costs Better? The Boeing Company or Carlisle Companies Incorporated
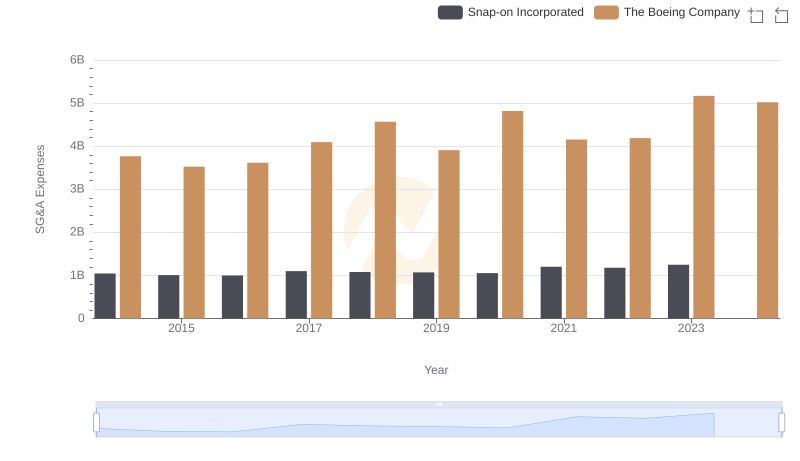
The Boeing Company or Snap-on Incorporated: Who Manages SG&A Costs Better?
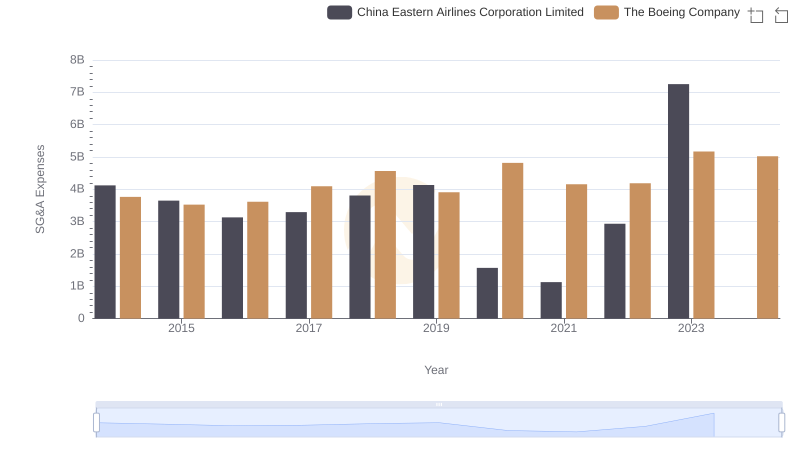
Who Optimizes SG&A Costs Better? The Boeing Company or China Eastern Airlines Corporation Limited
Cost Management Insights: SG&A Expenses for The Boeing Company and Expeditors International of Washington, Inc.